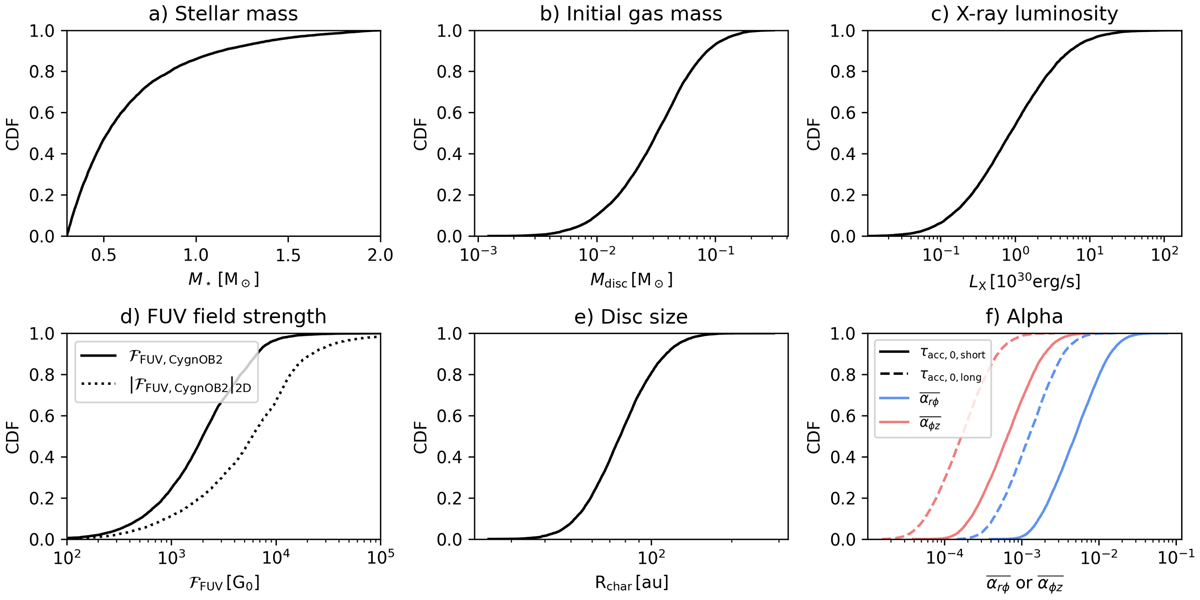
Fig. B.1
Download original image
Distributions of the initial conditions to set up our synthetic population, described in Section 3.2. Note that panel d) shows both the distribution of the actual 3D FUV field experienced in the cluster as well as the 2D projection and the X-ray luminosity distribution is shown in panel c). In panel f) we show the two sets of ![]() and
and ![]() that result from the two accretion timescales adopted (see Figure 3).
that result from the two accretion timescales adopted (see Figure 3).
Current usage metrics show cumulative count of Article Views (full-text article views including HTML views, PDF and ePub downloads, according to the available data) and Abstracts Views on Vision4Press platform.
Data correspond to usage on the plateform after 2015. The current usage metrics is available 48-96 hours after online publication and is updated daily on week days.
Initial download of the metrics may take a while.