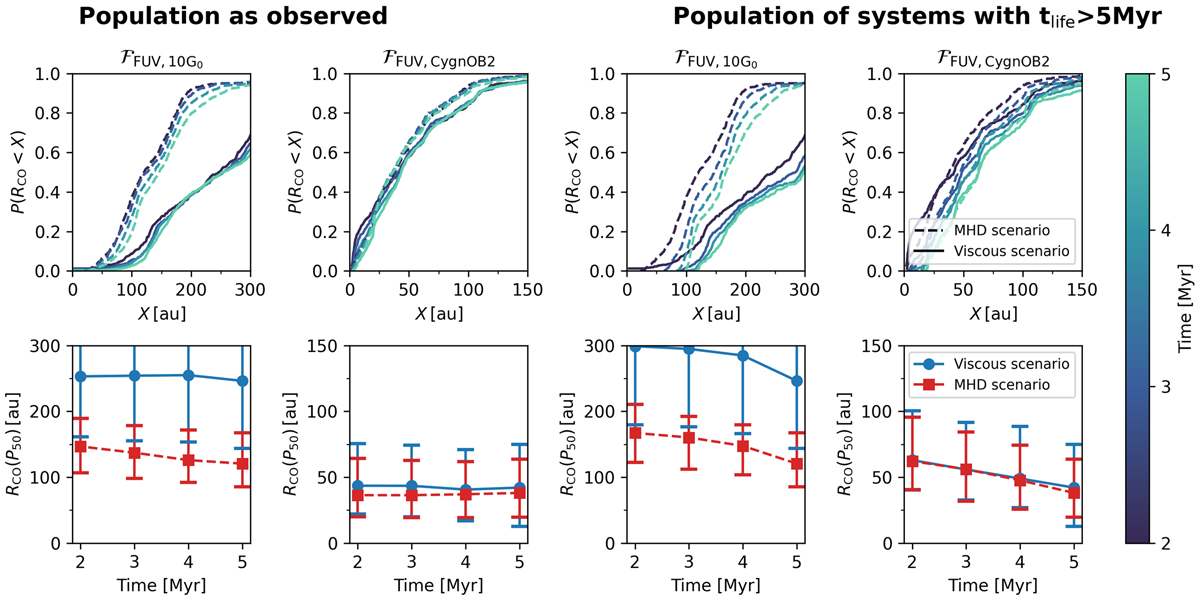
Fig. 7
Download original image
Time evolution of disc radii from fiducial populations (see Table 1). The top panels show the time evolution of the cumulative fractions of the disc radii, and the corresponding bottom panels show the evolution of the 50th percentile of the respective simulations in the top panel with markers indicating the 25th and 75th percentile. Note that the axis limits for the radii differ between low and high FUV field cases. The left panels show the population as it would be observed (i.e. distribution includes all discs present at the time). The right panels show the same simulations but only include systems that have a lifetime of tlife > 5 Myr.
Current usage metrics show cumulative count of Article Views (full-text article views including HTML views, PDF and ePub downloads, according to the available data) and Abstracts Views on Vision4Press platform.
Data correspond to usage on the plateform after 2015. The current usage metrics is available 48-96 hours after online publication and is updated daily on week days.
Initial download of the metrics may take a while.