Open Access
Fig. 8
Download original image
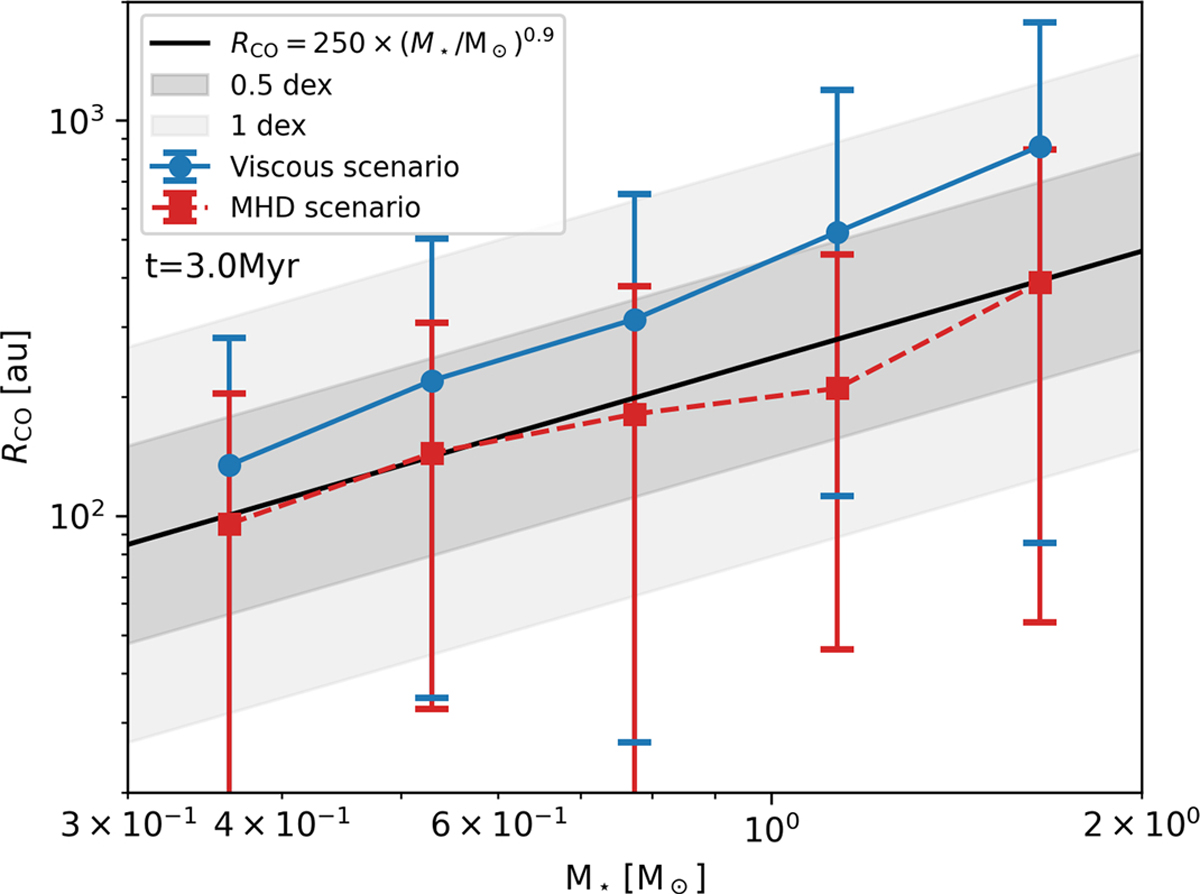
Stellar mass dependence of the disc radii from our fiducial populations with ![]() (see Table 1), shown at 3 Myr. The markers indicate the 25th and 75th percentiles. The observational trend (black line) is shown along a 0.5 and 1 dex spread around the mean (Andrews 2020).
(see Table 1), shown at 3 Myr. The markers indicate the 25th and 75th percentiles. The observational trend (black line) is shown along a 0.5 and 1 dex spread around the mean (Andrews 2020).
Current usage metrics show cumulative count of Article Views (full-text article views including HTML views, PDF and ePub downloads, according to the available data) and Abstracts Views on Vision4Press platform.
Data correspond to usage on the plateform after 2015. The current usage metrics is available 48-96 hours after online publication and is updated daily on week days.
Initial download of the metrics may take a while.