Fig. 10.
Download original image
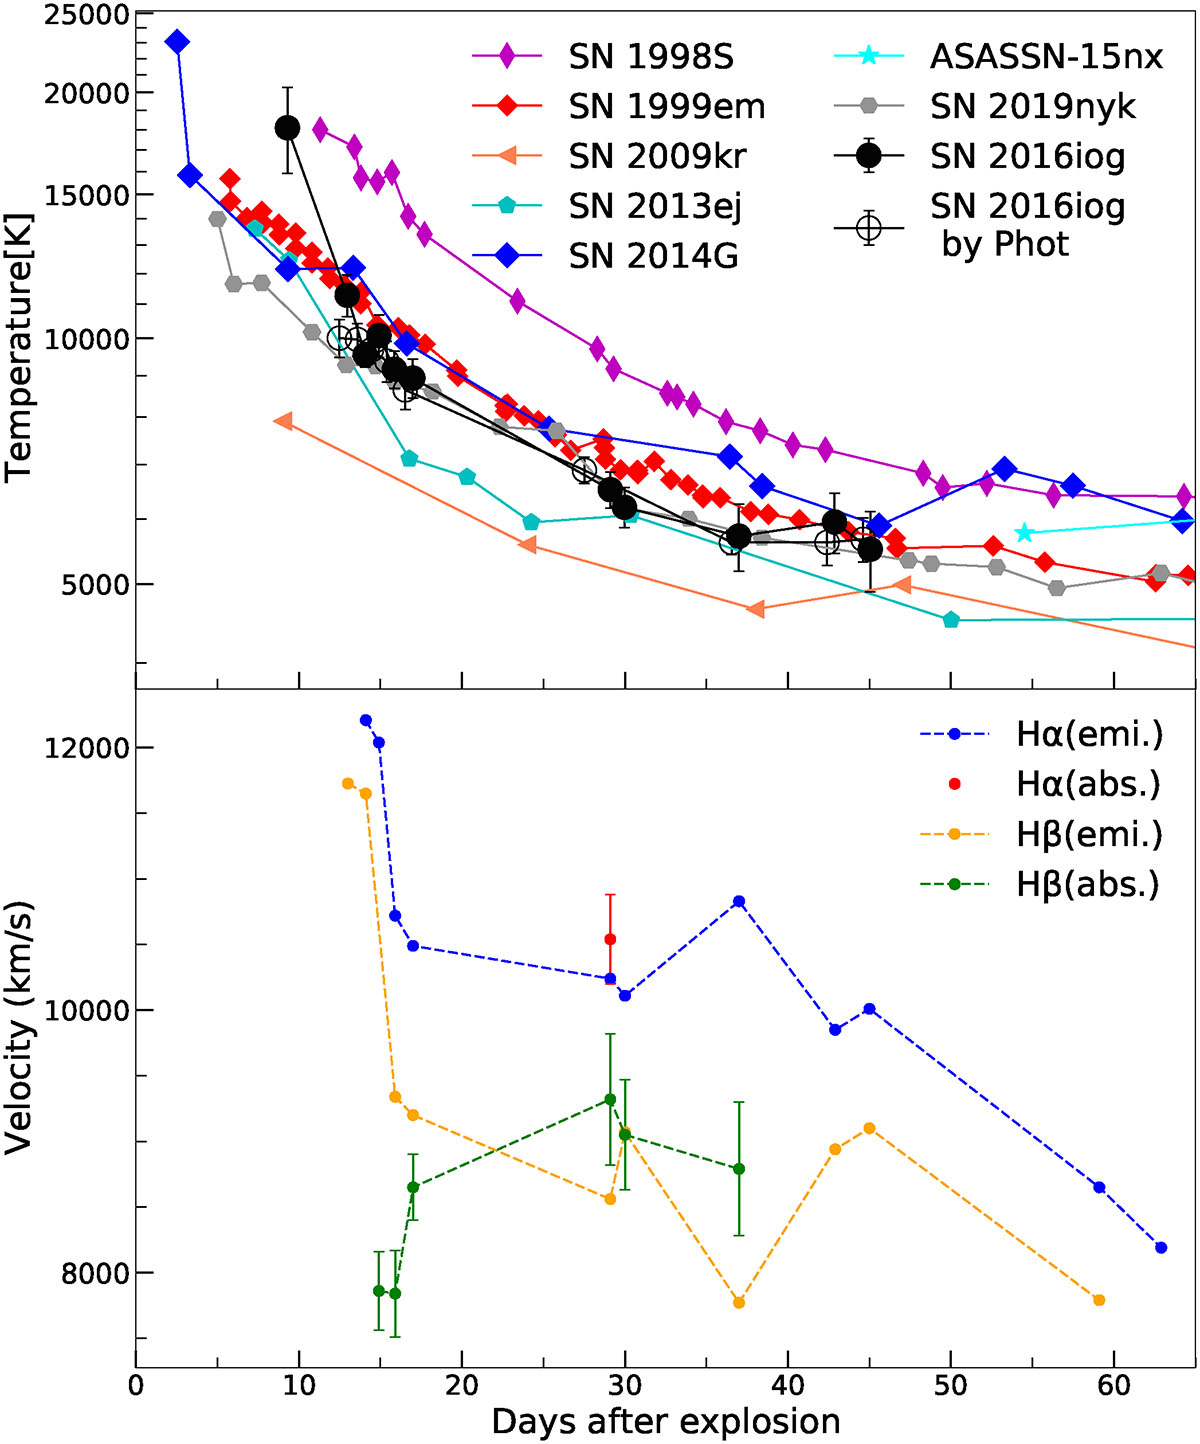
Spectroscopic measurements of SN 2016iog compared with those of other Type II SNe. Top panel: Temperature evolution of SN 2016iog, compared with other SNe. The solid black dots represent the temperatures of SN 2016iog derived from spectroscopic blackbody fits, while the black hollow dots represent the temperatures from blackbody fits to the photometry. The values reported for SN 2009kr were derived from the spectra presented in Elias-Rosa et al. (2010), those for ASASSN-15nx were obtained from the spectra shown in Bose et al. (2018), while for the other SNe, the values from the literature were used. Bottom panel: Velocity evolution of the Balmer lines of SN 2016iog. The suffix abs. denotes velocities measured from the minimum of the H absorption trough, while emi. refers to velocities derived from the FWHM of the emission component.
Current usage metrics show cumulative count of Article Views (full-text article views including HTML views, PDF and ePub downloads, according to the available data) and Abstracts Views on Vision4Press platform.
Data correspond to usage on the plateform after 2015. The current usage metrics is available 48-96 hours after online publication and is updated daily on week days.
Initial download of the metrics may take a while.