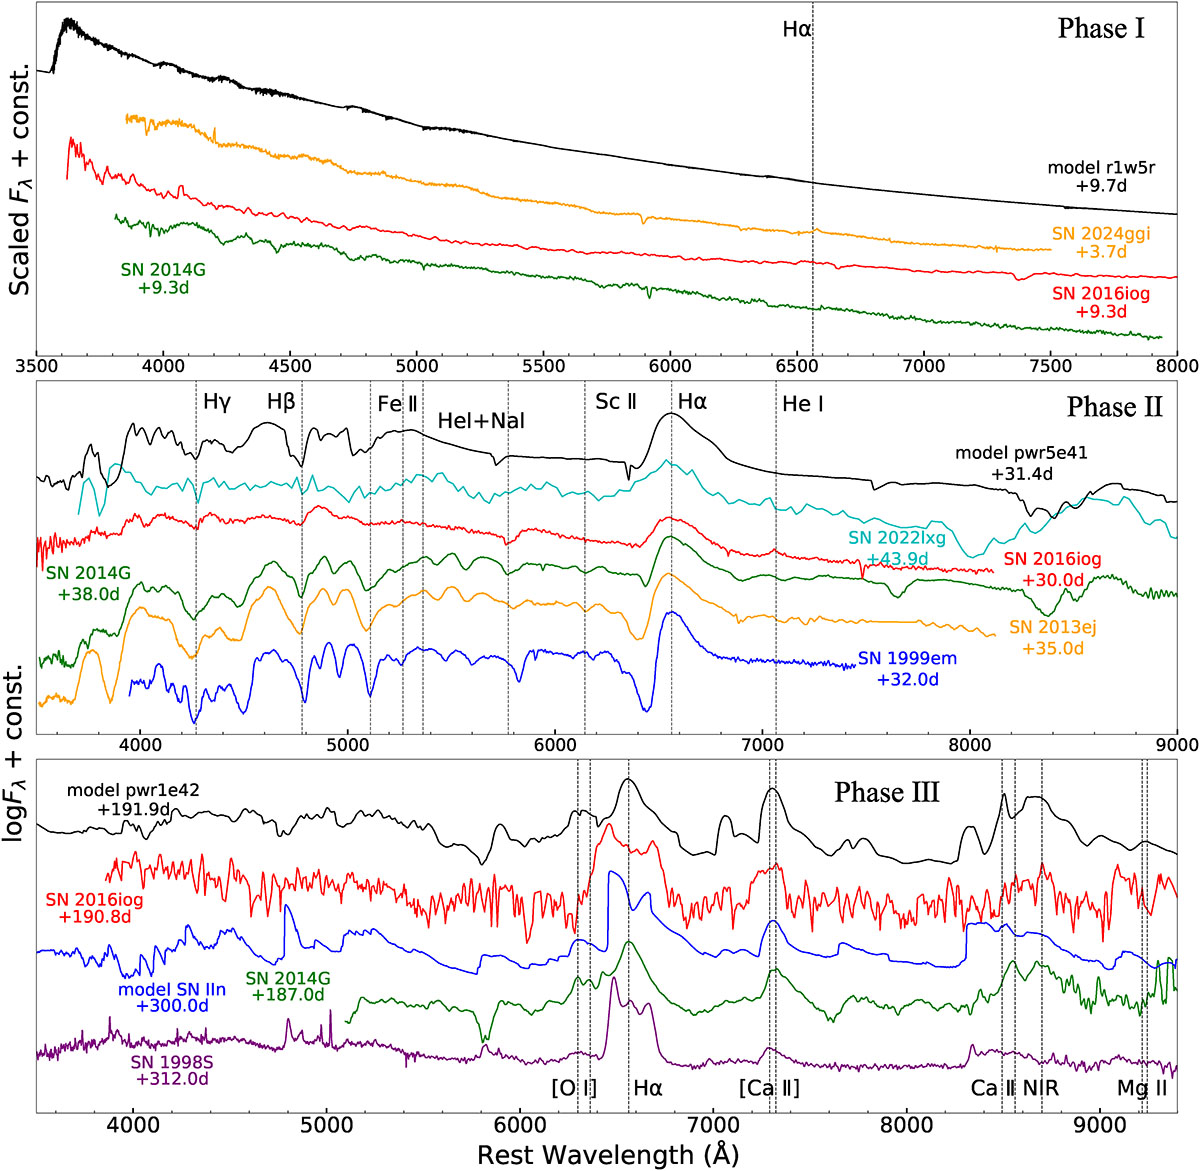
Fig. 14.
Download original image
Comparison of the spectra of SN 2016iog at different phases with those of other Type II SNe and model spectra. Top panel: Early-phase spectra of SN 2016iog at +9.3 days are compared with those of SNe 2014G, 2024ggi, and the r1w5r model at similar phases. Middle panel: Recombination-phase spectra of SN 2016iog at +30.0 days are compared with those of SNe 1999em, 2013ej, 2014G, 2022lxg and the pwr5e41 model at similar phases. Bottom panel: Nebular-phase spectra of SN 2016iog at +190.8 days are compared with those of SNe 1998S, 2014G, the SN IIn model, and the pwr1e42 model at similar phases. All observed spectra are in the rest frame and have been corrected for reddening. The spectra have been scaled for improved comparison.
Current usage metrics show cumulative count of Article Views (full-text article views including HTML views, PDF and ePub downloads, according to the available data) and Abstracts Views on Vision4Press platform.
Data correspond to usage on the plateform after 2015. The current usage metrics is available 48-96 hours after online publication and is updated daily on week days.
Initial download of the metrics may take a while.