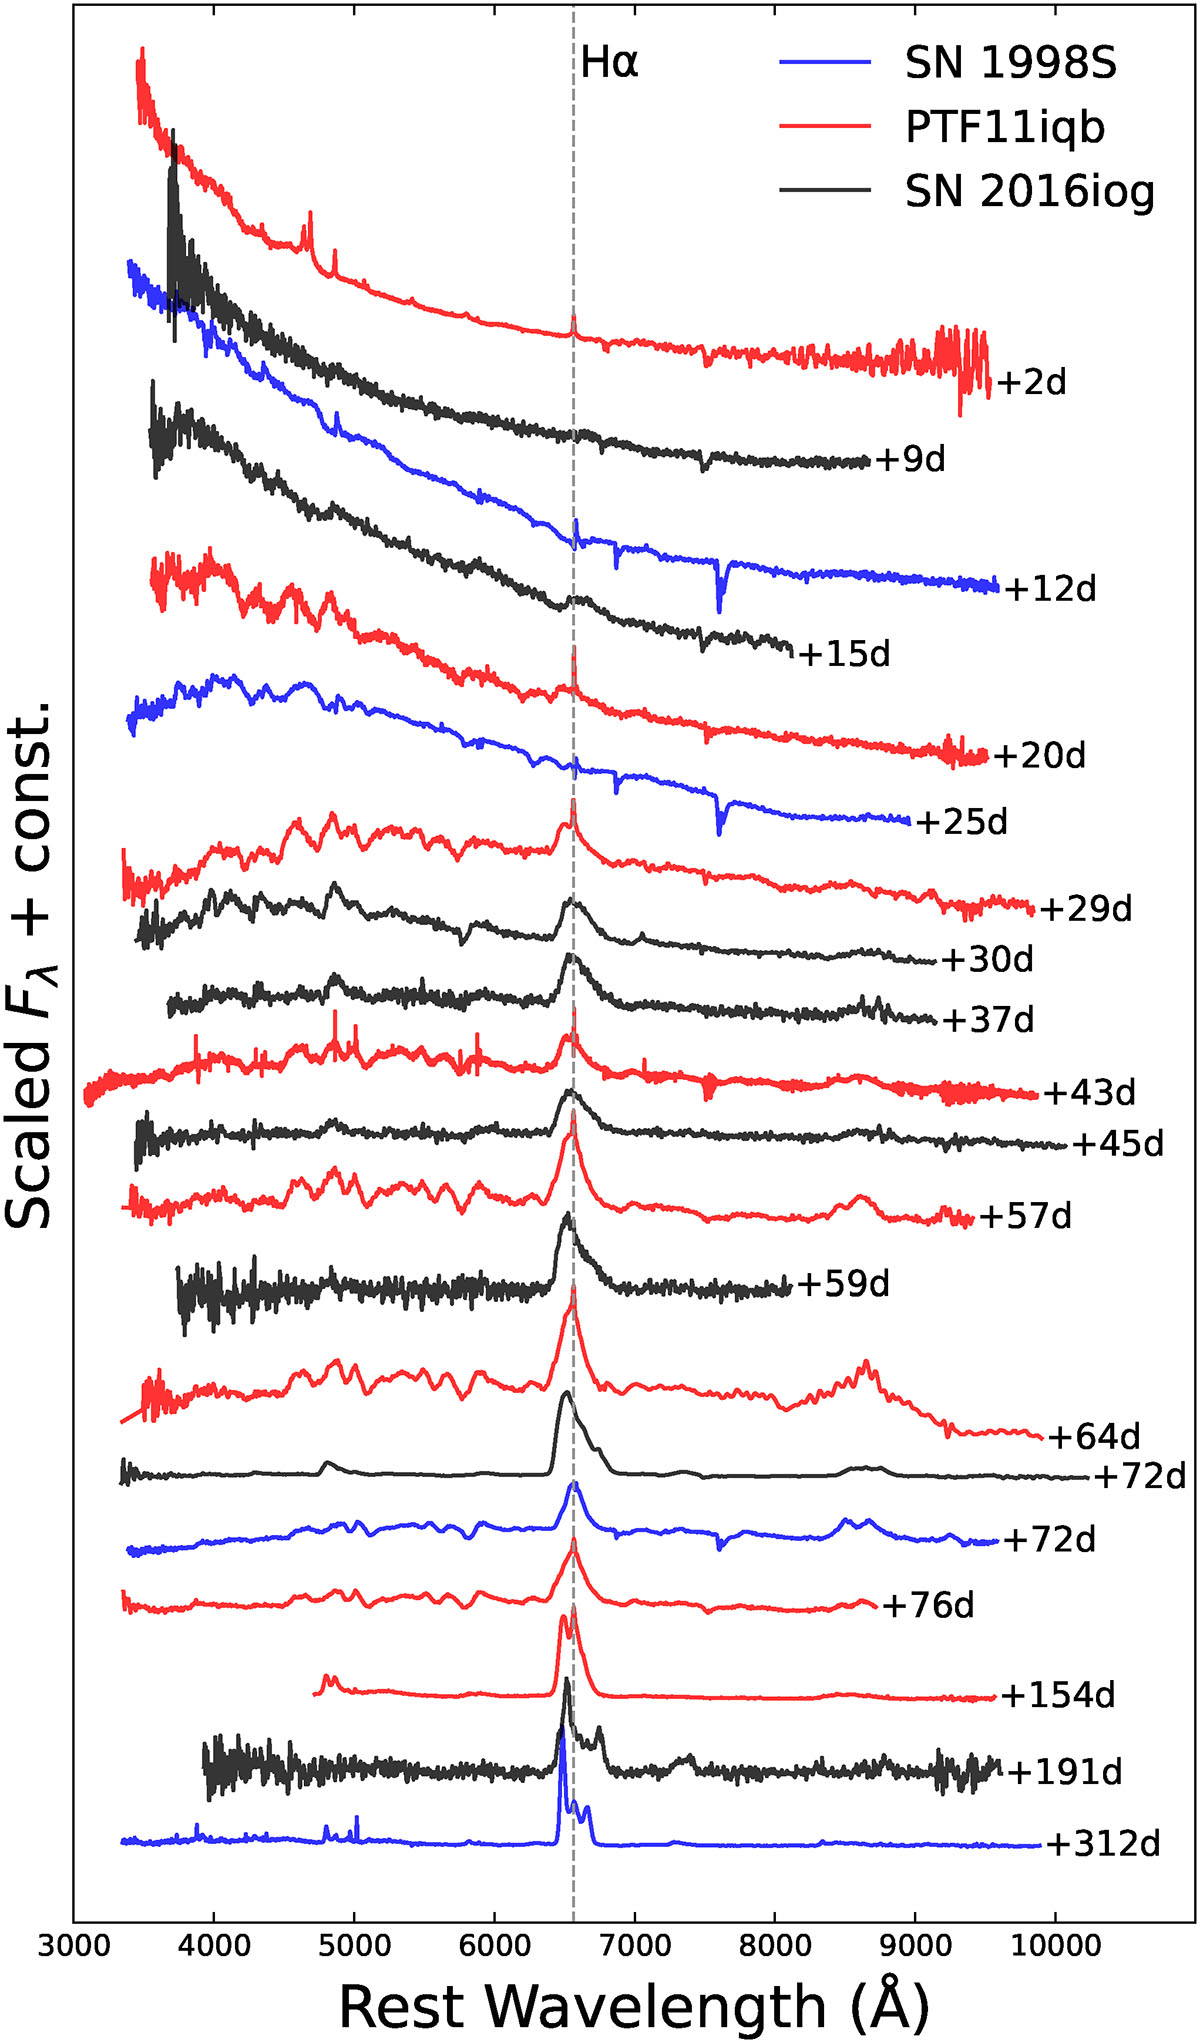
Fig. 17.
Download original image
Spectral evolution of SN 2016iog is compared with those of SN 1998S and PTF11iqb. All spectra of SN 2016iog are plotted in black, those of PTF11iqb in red, and those of SN 1998S in blue. The spectrum of PTF11iqb obtained at +2 days is taken from Smith et al. (2015), while the remaining spectra of PTF11iqb are retrieved from the Padova-Asiago Spectra Archive and will be presented in a forthcoming paper on PTF11iqb.
Current usage metrics show cumulative count of Article Views (full-text article views including HTML views, PDF and ePub downloads, according to the available data) and Abstracts Views on Vision4Press platform.
Data correspond to usage on the plateform after 2015. The current usage metrics is available 48-96 hours after online publication and is updated daily on week days.
Initial download of the metrics may take a while.