Open Access
Fig. 18.
Download original image
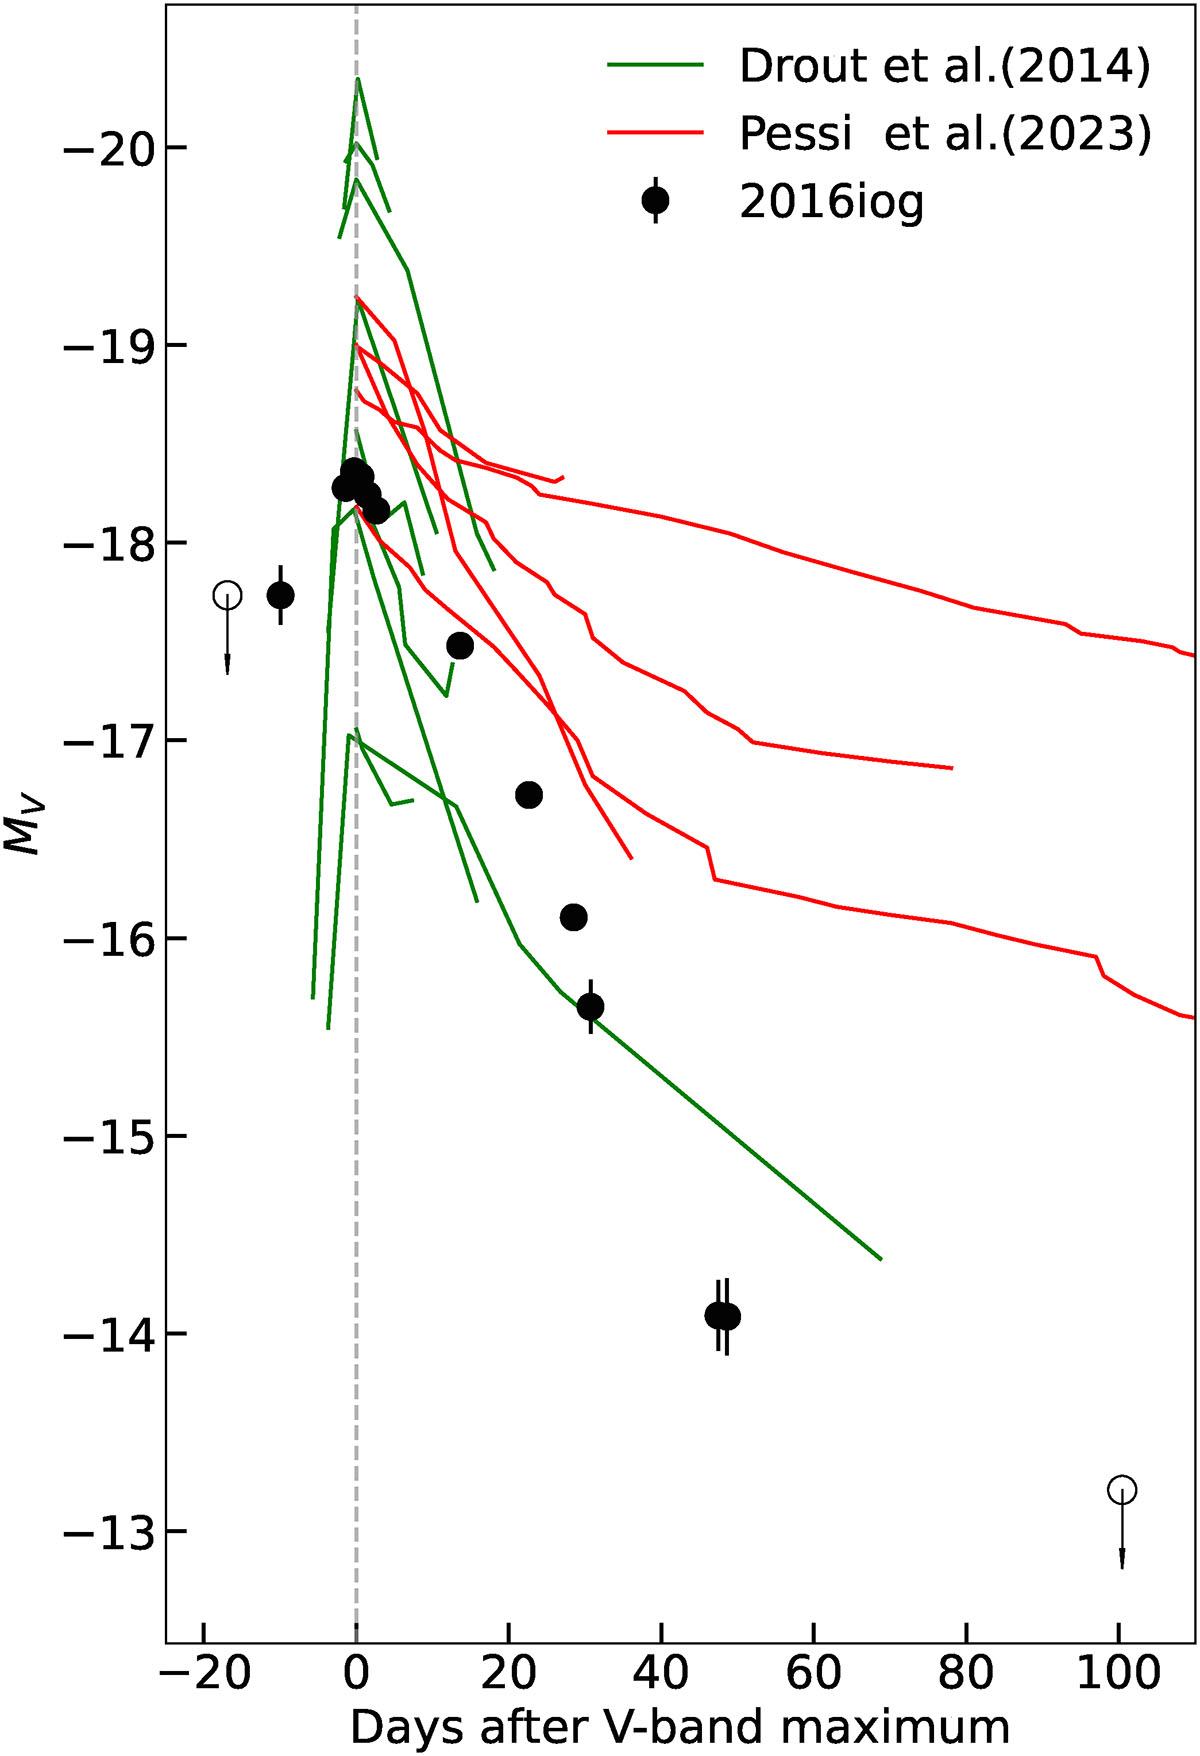
Comparison of the absolute V-band LC of SN 2016iog with other rapidly evolving transients. The V-band data from Pessi et al. (2023) are shown as red lines, while the sample from Drout et al. (2014), which lacks V-band observations, is represented by the r/z-band data shown as green lines.
Current usage metrics show cumulative count of Article Views (full-text article views including HTML views, PDF and ePub downloads, according to the available data) and Abstracts Views on Vision4Press platform.
Data correspond to usage on the plateform after 2015. The current usage metrics is available 48-96 hours after online publication and is updated daily on week days.
Initial download of the metrics may take a while.