Fig. 8.
Download original image
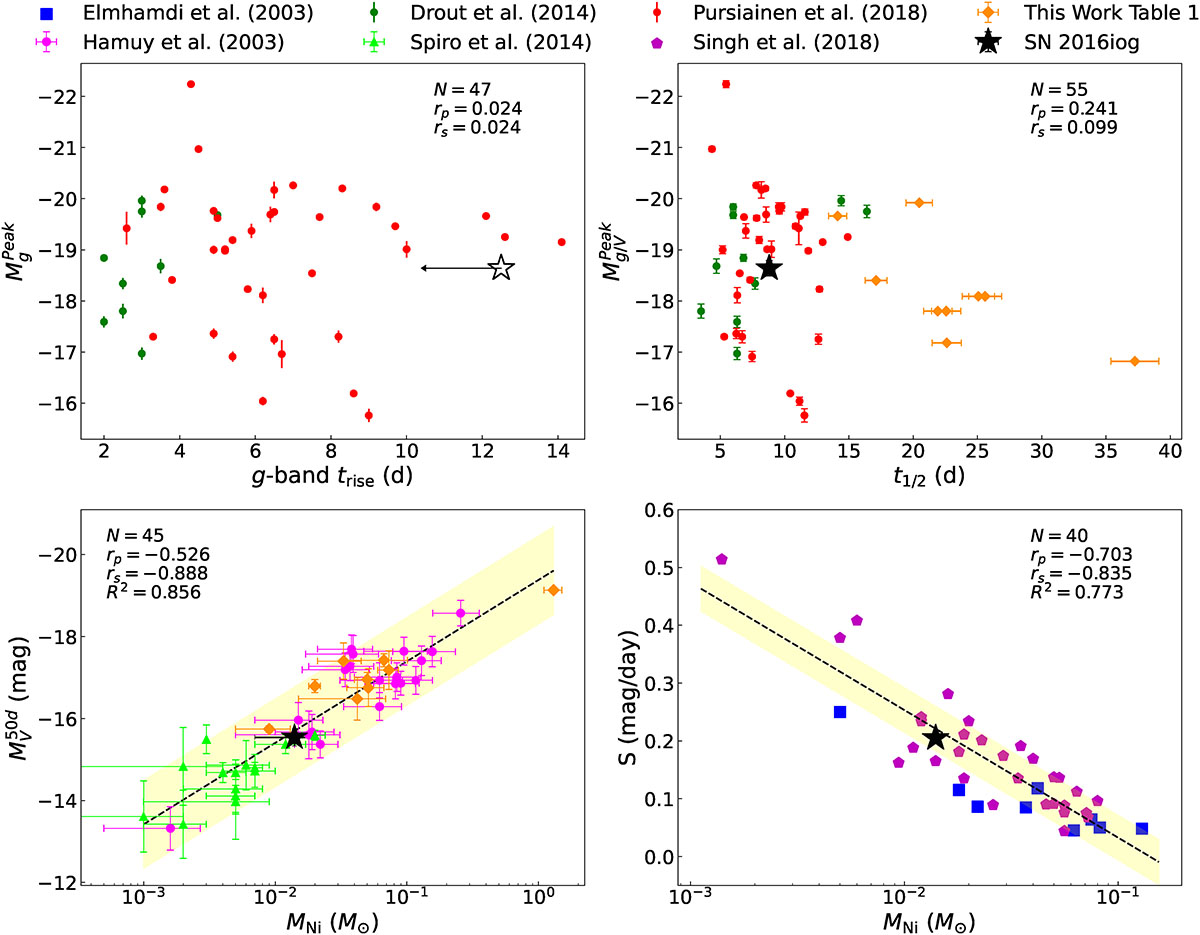
Correlations between parameters of Type II SNe. Top left: Absolute g-band peak magnitude versus g-band rise time, with the first g-band point of SN 2016iog taken as a upper limit owing to the lack of rising-phase data; Top right: Absolute g/V-band peak magnitude versus the time above half-maximum (t1/2), with the data from Drout et al. (2014) in the g-band, and those from Pursiainen et al. (2018), this work Table 2, and SN 2016iog in the V-band.; Bottom left: Absolute V-band magnitude at t = 50 days (![]() ) versus the ejected 56Ni masses (MNi); Bottom right: V-band LC maximum decline rate (steepness parameter, S) versus the ejected 56Ni masses (MNi). The weighted Pearson correlation coefficient (rp), the Spearman rank correlation coefficient (rs), and the number of SNe (N), are provided for each parameters pair. The dashed black line represents the linear relationship between the two parameters, and the yellow region indicates the error range. R2 represents the coefficient of determination.
) versus the ejected 56Ni masses (MNi); Bottom right: V-band LC maximum decline rate (steepness parameter, S) versus the ejected 56Ni masses (MNi). The weighted Pearson correlation coefficient (rp), the Spearman rank correlation coefficient (rs), and the number of SNe (N), are provided for each parameters pair. The dashed black line represents the linear relationship between the two parameters, and the yellow region indicates the error range. R2 represents the coefficient of determination.
Current usage metrics show cumulative count of Article Views (full-text article views including HTML views, PDF and ePub downloads, according to the available data) and Abstracts Views on Vision4Press platform.
Data correspond to usage on the plateform after 2015. The current usage metrics is available 48-96 hours after online publication and is updated daily on week days.
Initial download of the metrics may take a while.