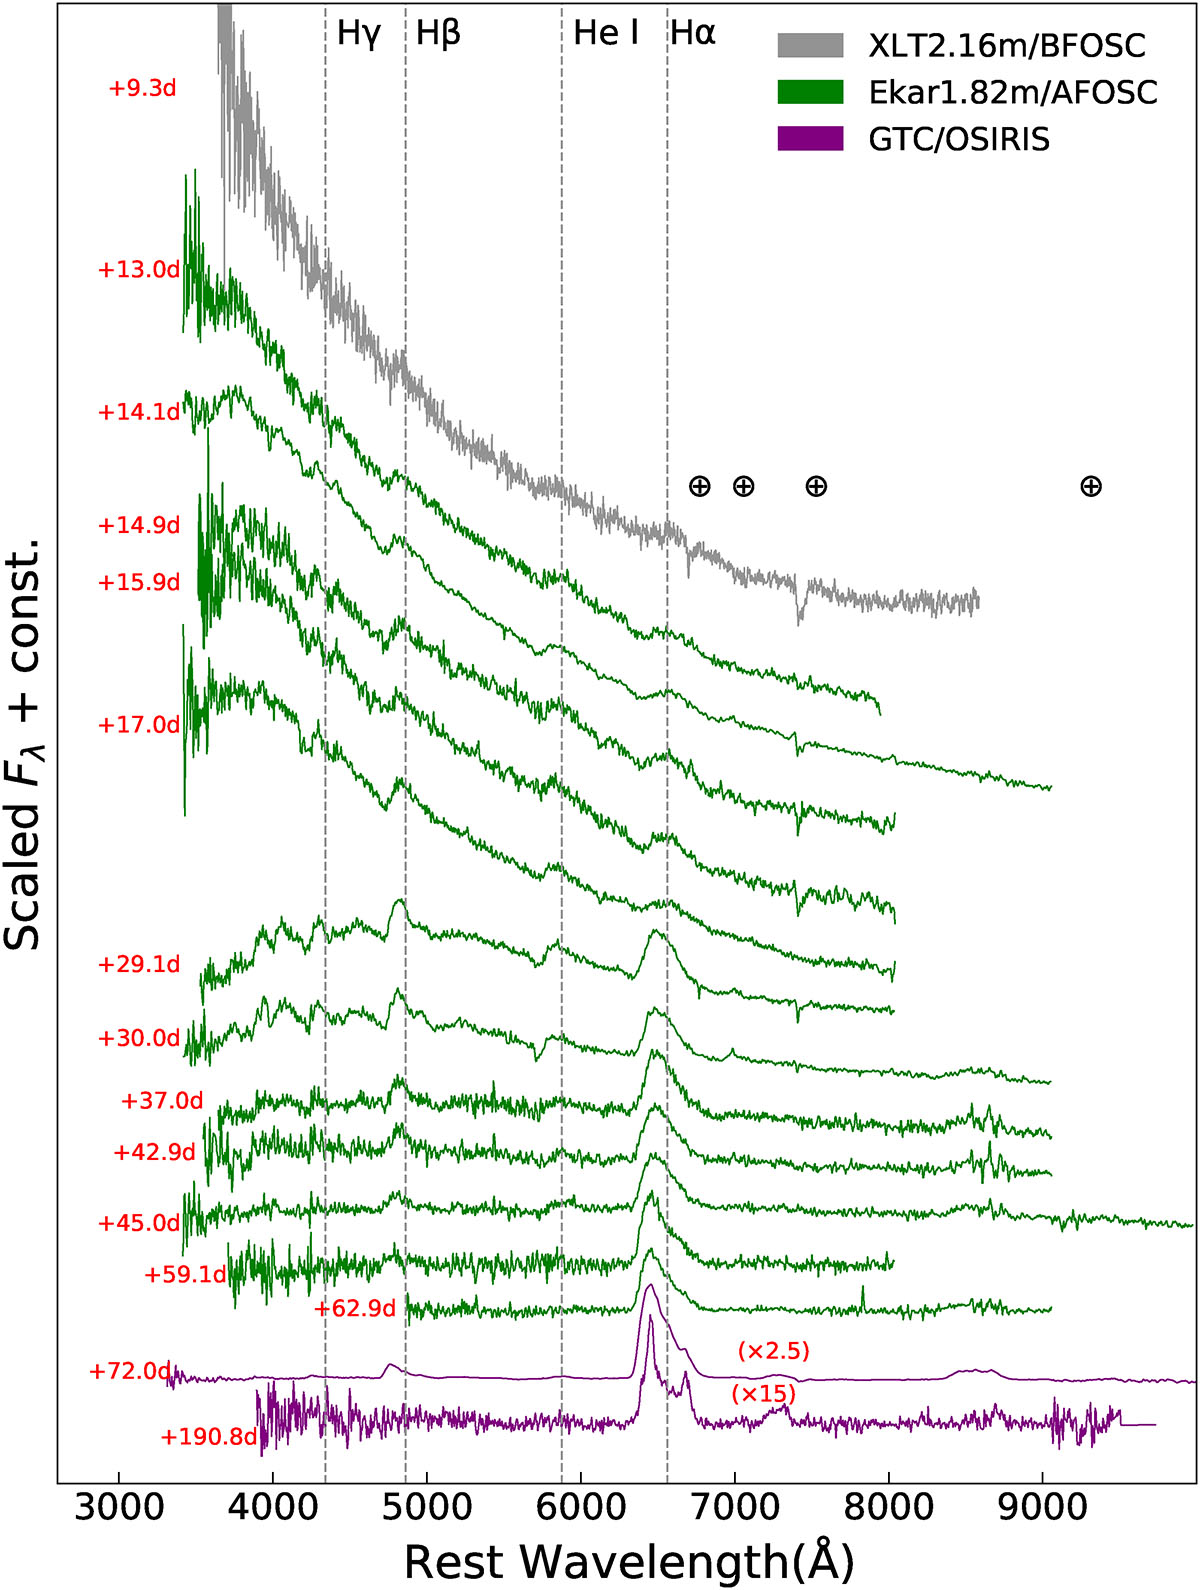
Fig. 9.
Download original image
Optical spectral evolution of SN 2016iog from +9.3 days to +190.8 days since the explosion. The spectra have been corrected for reddening and redshift, and vertically shifted for better visualisation. The last two spectra have been amplified by different intensity factors to make them more prominent. The epochs used are indicated to the left of each spectrum. Different colours are employed to distinguish between the various telescopes, with the corresponding telescope labels shown in the upper right corner. The positions of major telluric absorption lines are denoted by the ⨁ symbol.
Current usage metrics show cumulative count of Article Views (full-text article views including HTML views, PDF and ePub downloads, according to the available data) and Abstracts Views on Vision4Press platform.
Data correspond to usage on the plateform after 2015. The current usage metrics is available 48-96 hours after online publication and is updated daily on week days.
Initial download of the metrics may take a while.