Fig. 3.
Download original image
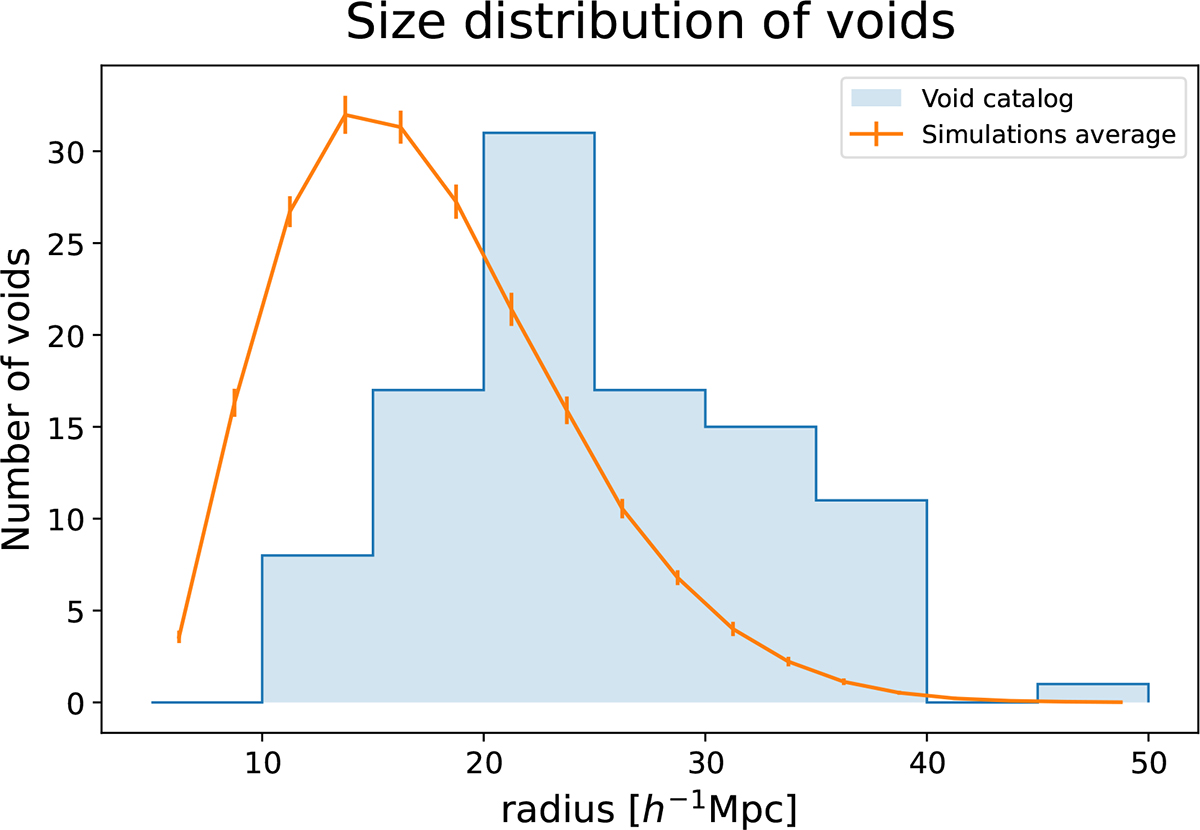
Histogram of the distribution of the void radii for the catalog of high-significance voids (blue) and for the average distribution of individual simulations (orange). The y-axis shows the actual number in each radius bin for the high-significance voids. The orange curve is arbitrarily rescaled to make it comparable. The two histograms illustrate how smaller voids in a single realization of the large-scale structure are more likely to be spurious or less significant, with only a fraction of them contributing to the final catalog.
Current usage metrics show cumulative count of Article Views (full-text article views including HTML views, PDF and ePub downloads, according to the available data) and Abstracts Views on Vision4Press platform.
Data correspond to usage on the plateform after 2015. The current usage metrics is available 48-96 hours after online publication and is updated daily on week days.
Initial download of the metrics may take a while.