Fig. 4.
Download original image
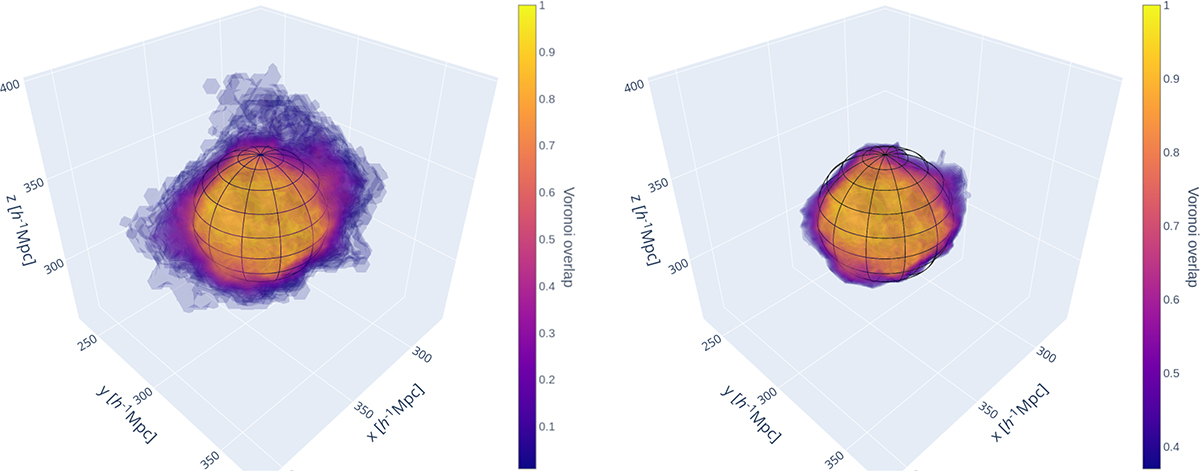
Left panel: Full Voronoi cloud of an example void around its center. The color scale represents the Voronoi overlap rate, ranging from 0 to 1, i.e., how likely a point is to belong to the void throughout different realizations. This value is loosely related to the actual underlying probability distribution, with the yellow regions corresponding to the innermost underdense environment. The wire-frame sphere in the middle represents the effective volume of the void, and the Voronoi cloud extends significantly beyond this region. Right panel: Voronoi cloud truncated to make values of Voronoi overlap rate greater than 0.37, as interpolated from the linear fit of Figure B.1 in Appendix B. The outskirts are removed, and the remaining cloud conserves the mean volume inferred from the Bayesian analysis, while still retaining information on the shape of the void.
Current usage metrics show cumulative count of Article Views (full-text article views including HTML views, PDF and ePub downloads, according to the available data) and Abstracts Views on Vision4Press platform.
Data correspond to usage on the plateform after 2015. The current usage metrics is available 48-96 hours after online publication and is updated daily on week days.
Initial download of the metrics may take a while.