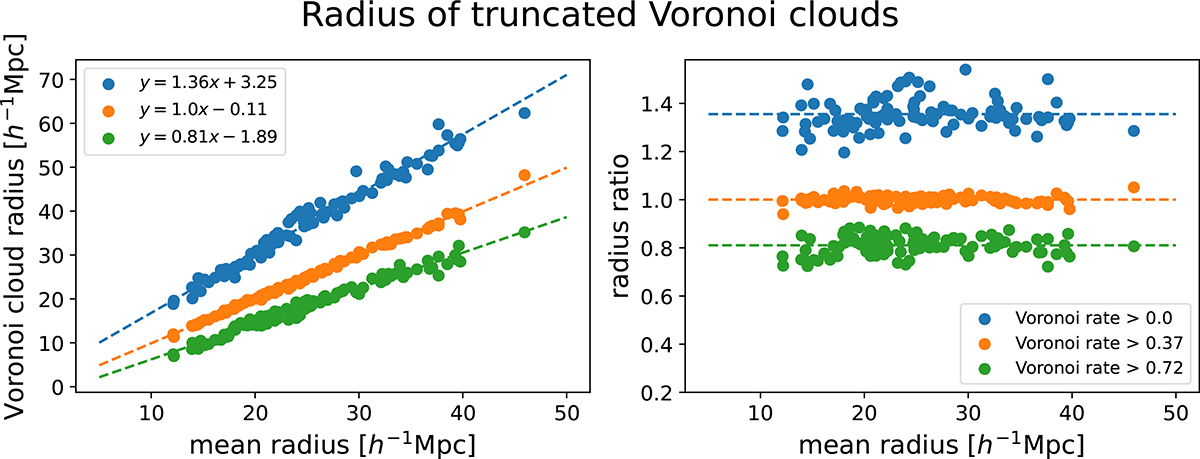
Fig. B.1.
Download original image
Left panel: Mean radius inferred from the posterior distribution vs effective radius of the corresponding Voronoi cloud with different truncation thresholds of rVoro > 0 (blue); 0.37 (orange); 0.72 (green). Right panel: Ratio of the radii estimated in the two different ways, after subtracting the y axis offset, which is in the order of a few h−1 Mpc for all cases. The relation is linear for all three cases, and provides information on the threshold to impose in order to achieve a certain depth in the void profile.
Current usage metrics show cumulative count of Article Views (full-text article views including HTML views, PDF and ePub downloads, according to the available data) and Abstracts Views on Vision4Press platform.
Data correspond to usage on the plateform after 2015. The current usage metrics is available 48-96 hours after online publication and is updated daily on week days.
Initial download of the metrics may take a while.