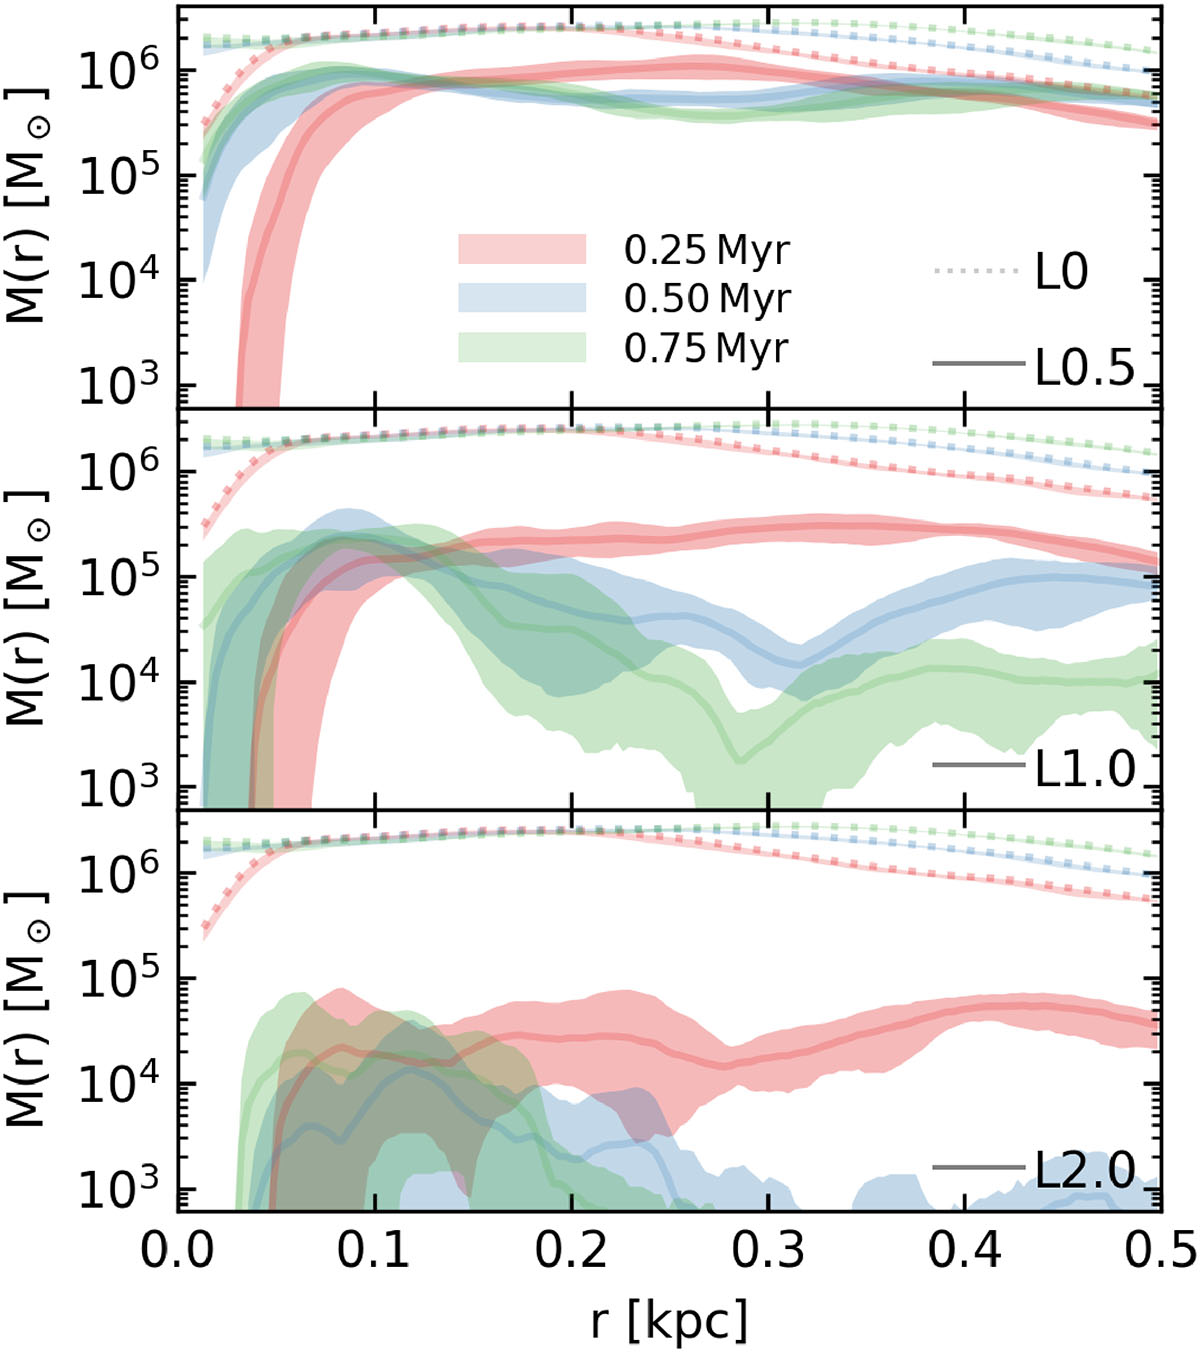
Fig. 3.
Download original image
Mass of cold rapidly infalling gas in radial 3.3-pc-wide bins at 0.25, 0.5, and 0.75 Myr (solid red, blue, and green lines and shading, respectively) in simulations L0.5, L1.0, and L2.0 (top, middle, and bottom panels, respectively). Solid lines show the mean of the four stochastically different simulations; shading encompasses their full range. Dotted lines in each panel show equivalent results from the control simulation.
Current usage metrics show cumulative count of Article Views (full-text article views including HTML views, PDF and ePub downloads, according to the available data) and Abstracts Views on Vision4Press platform.
Data correspond to usage on the plateform after 2015. The current usage metrics is available 48-96 hours after online publication and is updated daily on week days.
Initial download of the metrics may take a while.