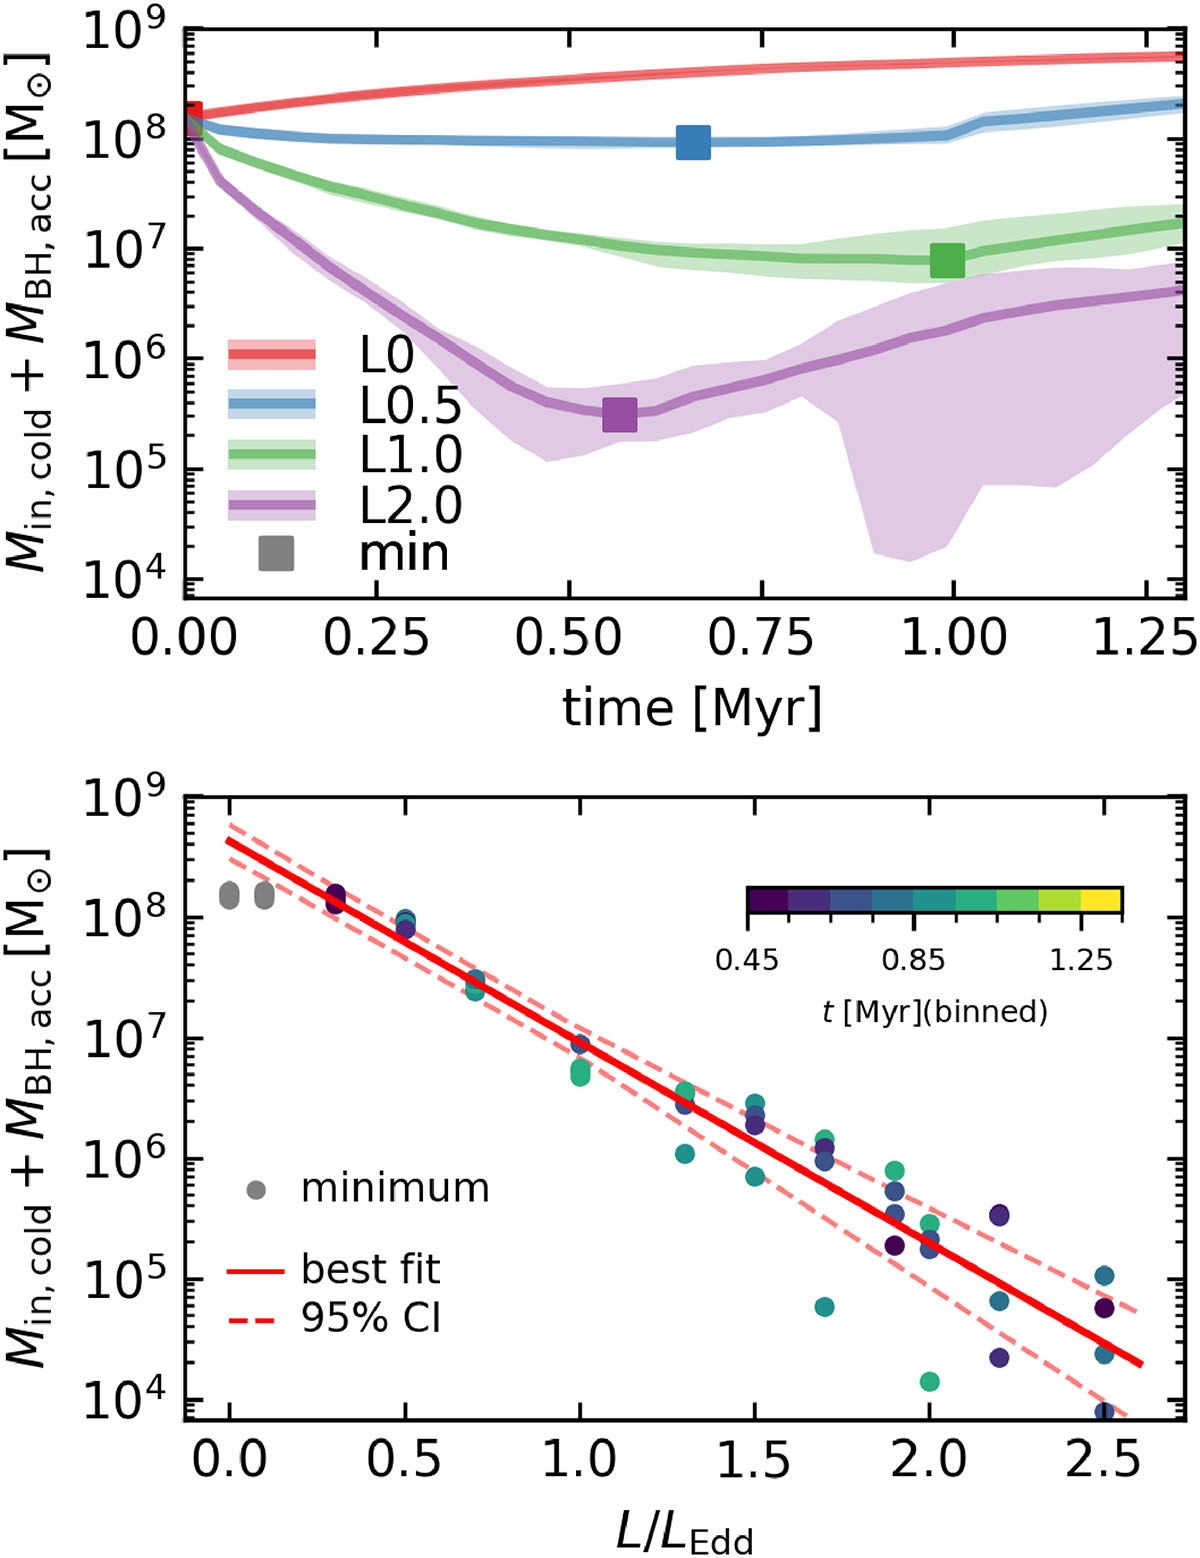
Fig. 4.
Download original image
Top: Total mass of cold rapidly infalling gas within the central 500 pc as a function of time in the control (red), L0.5 (blue), L1.0 (green), and L2.0 (magenta) simulations. We added the mass accreted by the SMBH particle to this total. Solid lines show the mean of the four stochastically different simulations; shading encompasses their full range. Squares mark the times when the mean mass reaches its minimum value. Bottom: Minimum value of cold rapidly infalling gas mass in all simulations (circles) as a function of luminosity, with colours denoting the time when the minimum is reached. The solid red line is the best linear fit between log M and LAGN of all simulations except the control and L0.1; the dashed lines indicate 95% confidence limits on the line parameters, estimated via bootstrapping.
Current usage metrics show cumulative count of Article Views (full-text article views including HTML views, PDF and ePub downloads, according to the available data) and Abstracts Views on Vision4Press platform.
Data correspond to usage on the plateform after 2015. The current usage metrics is available 48-96 hours after online publication and is updated daily on week days.
Initial download of the metrics may take a while.