Fig. 5.
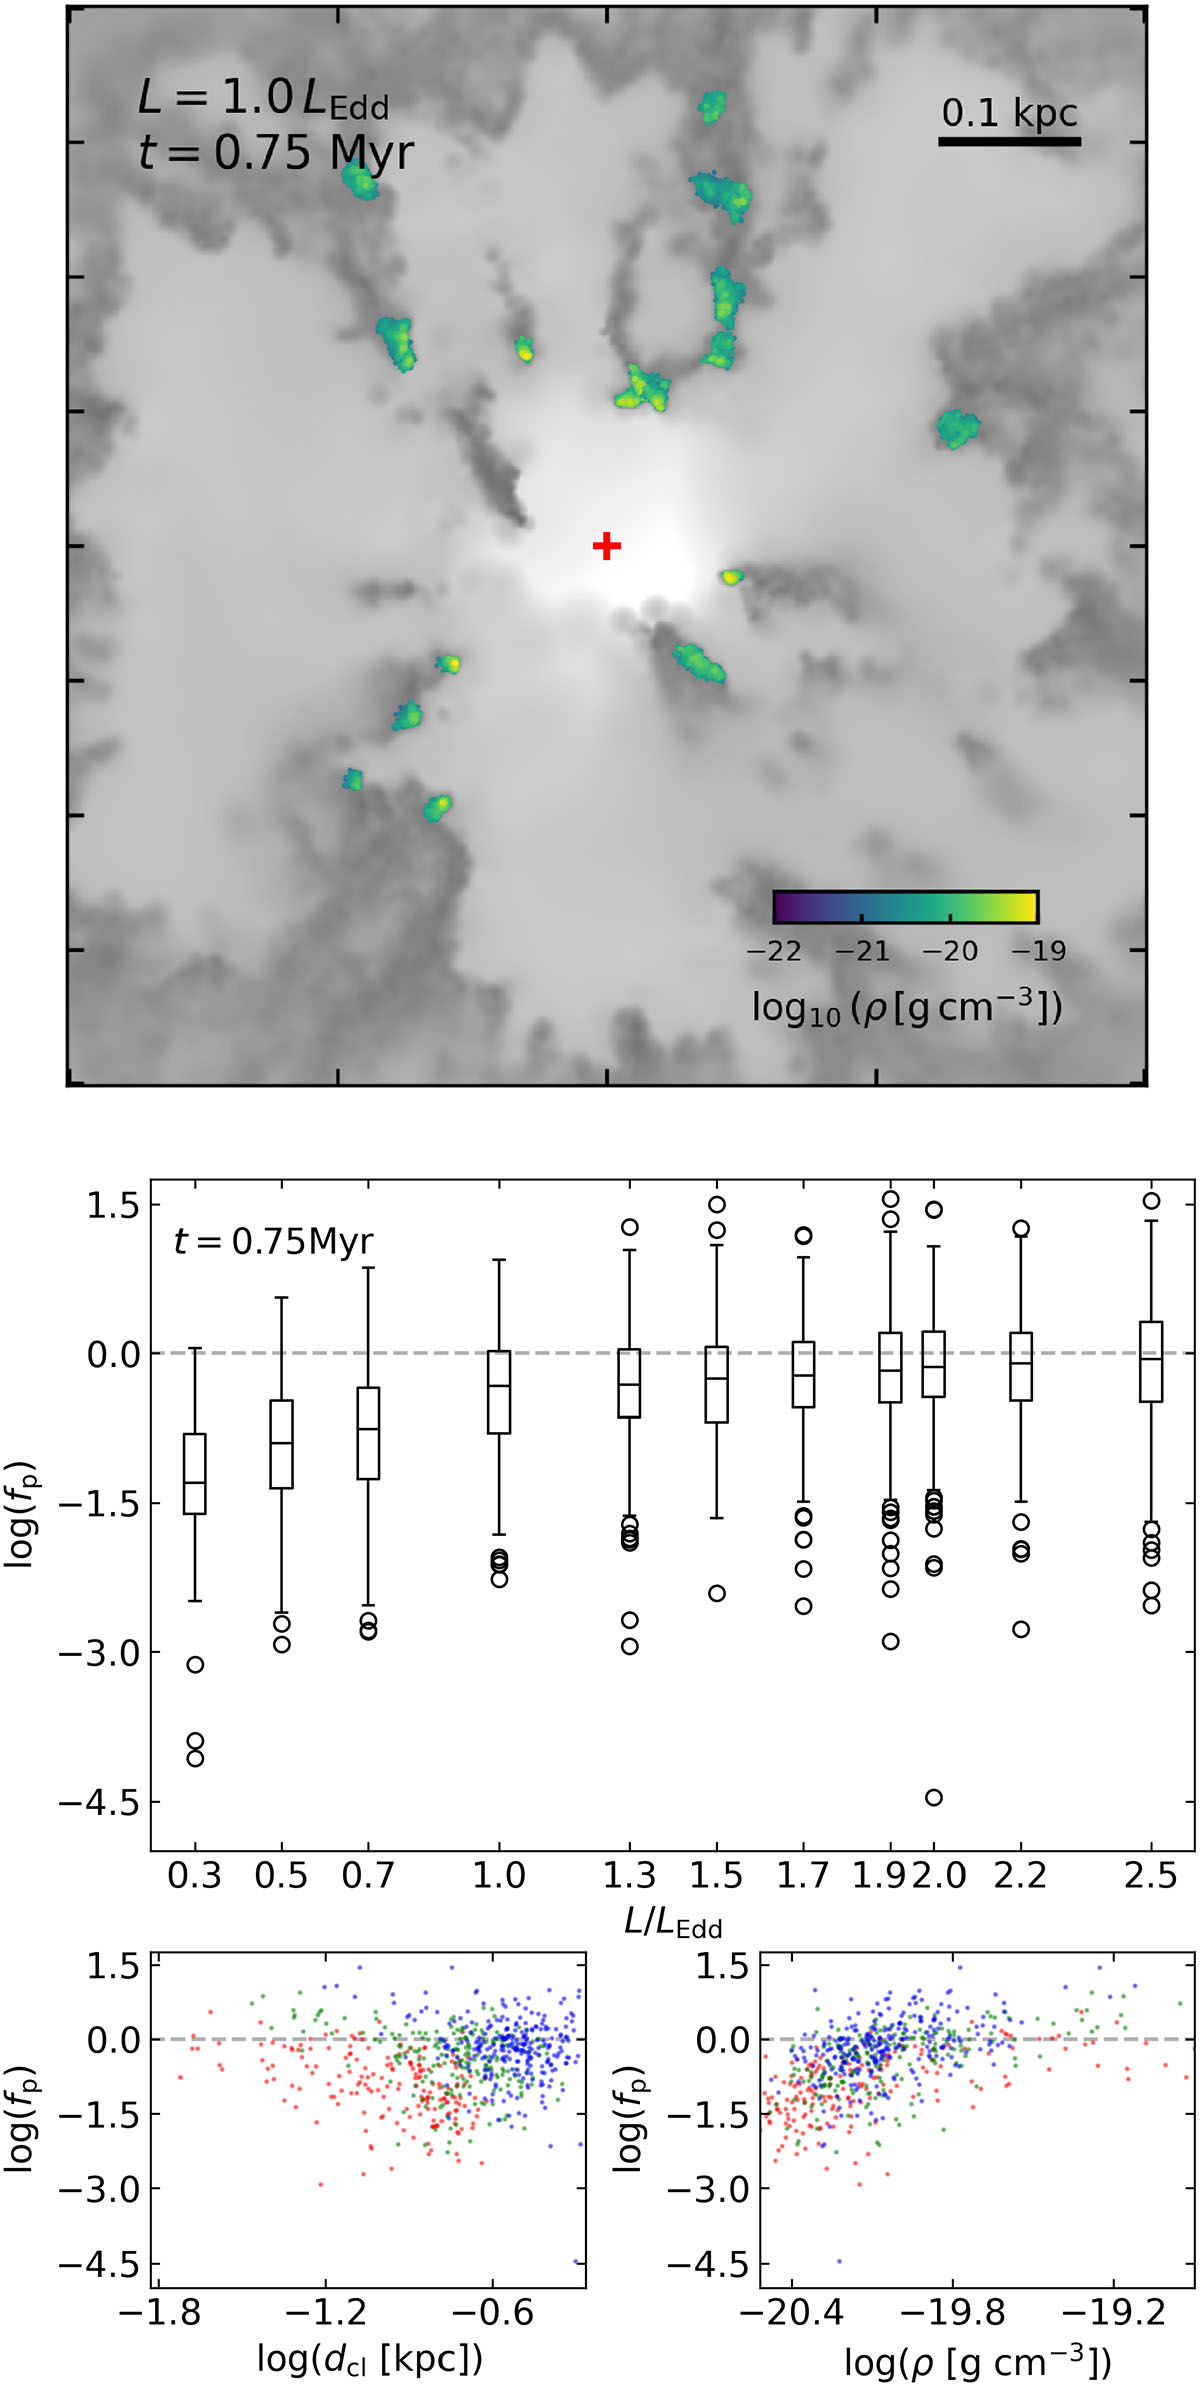
Download original image
Top: Clusters (coloured by gas density) detected at t = 0.75 Myr in simulation L1.0, plotted over the gas density map (grey scale). Middle panel: Momentum loading factor (fp) distributions (Eq. (9); box and whisker plots) in simulations with different AGN luminosities. Circles highlight outliers beyond 1.5 times the interquartile range covered by the whiskers. The horizontal dashed line highlights fp = 1, which corresponds to pure momentum driving, for ease of comparison. Bottom panels: Momentum loading factor (fp) as a function of dcl (left) and mean gas density (right) in simulations L0.5 (red), L1.0 (green), and L2.0 (blue).
Current usage metrics show cumulative count of Article Views (full-text article views including HTML views, PDF and ePub downloads, according to the available data) and Abstracts Views on Vision4Press platform.
Data correspond to usage on the plateform after 2015. The current usage metrics is available 48-96 hours after online publication and is updated daily on week days.
Initial download of the metrics may take a while.