Fig. 6.
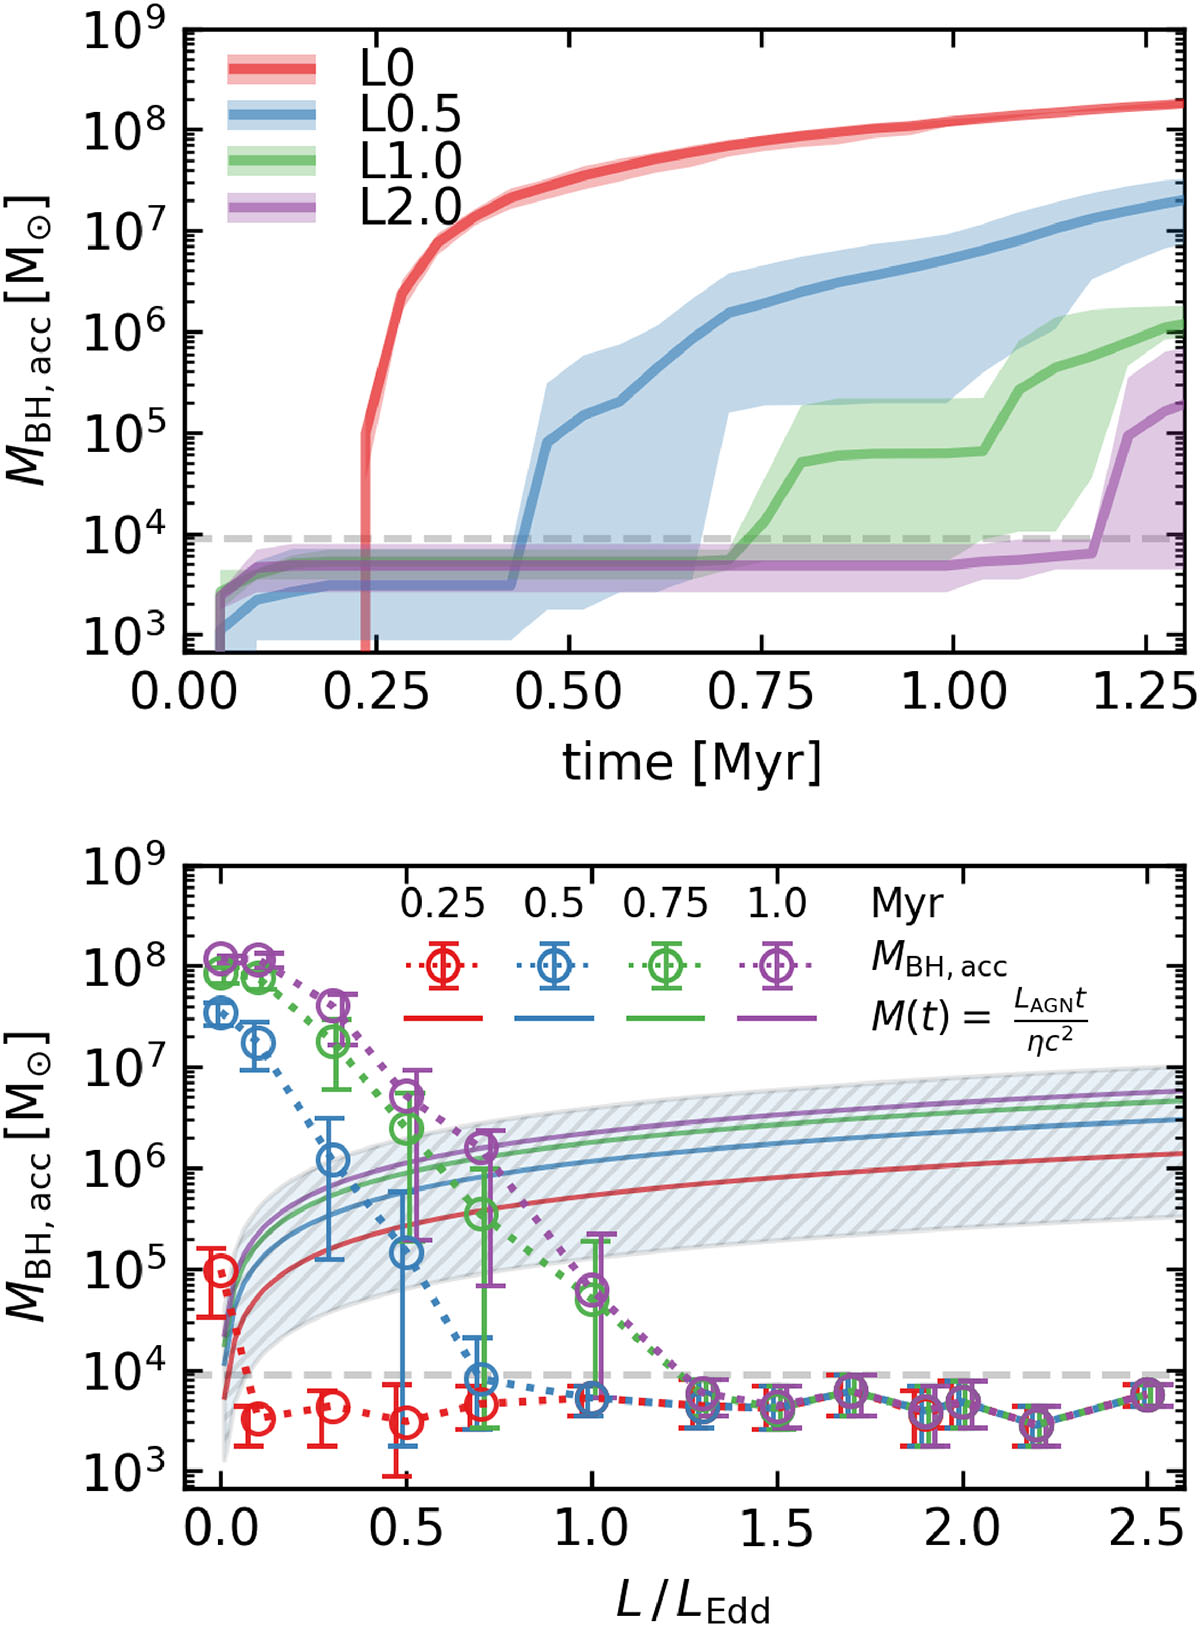
Download original image
Top: Same as the top panel of Fig. 4 but showing the change in SMBH particle mass. The horizontal dashed line shows M = 10mSPH. Bottom: Change in SMBH particle mass between the start of the simulation and t = 0.25, 0.5, 0.75, and 1 Myr (red, blue, green, and magenta circles, respectively), in simulations with different AGN luminosities. Error bars represent the range of values in stochastically different simulations; they are slightly offset horizontally for clarity. Solid lines show the SMBH mass change expected due to accretion powering an AGN of the given Eddington fraction over the same time intervals, assuming a radiative efficiency (η) of 0.1; the shaded region represents the effect of varying radiative efficiency between 0.057 and 0.42. The horizontal dashed line is the same as in top panel.
Current usage metrics show cumulative count of Article Views (full-text article views including HTML views, PDF and ePub downloads, according to the available data) and Abstracts Views on Vision4Press platform.
Data correspond to usage on the plateform after 2015. The current usage metrics is available 48-96 hours after online publication and is updated daily on week days.
Initial download of the metrics may take a while.