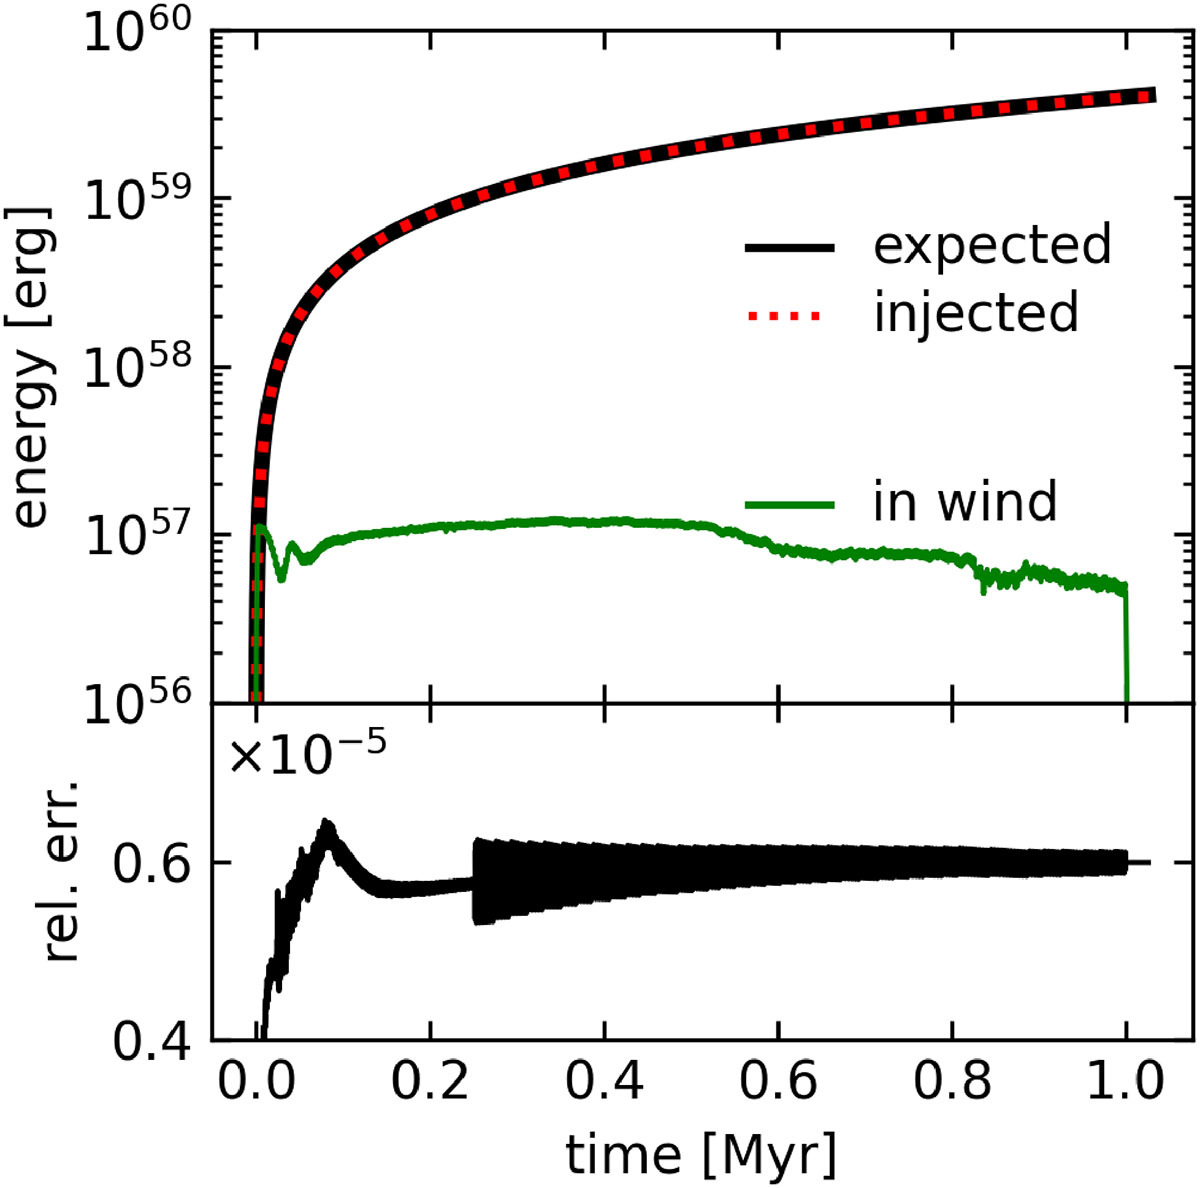
Fig. A.1.
Download original image
Top: Energy injection over time in simulation L1.0. The solid black line shows the expected injection, Etot, exp = LAGN × t. The solid green line shows Ew, the amount of energy contained within the wind that is yet to be injected. The dotted red line shows Einj, the actual amount of energy injected into the particles divided by η/2. Bottom: Relative error, Δinj = |Etot, exp−(Einj+Ew)|/Etot, exp.
Current usage metrics show cumulative count of Article Views (full-text article views including HTML views, PDF and ePub downloads, according to the available data) and Abstracts Views on Vision4Press platform.
Data correspond to usage on the plateform after 2015. The current usage metrics is available 48-96 hours after online publication and is updated daily on week days.
Initial download of the metrics may take a while.