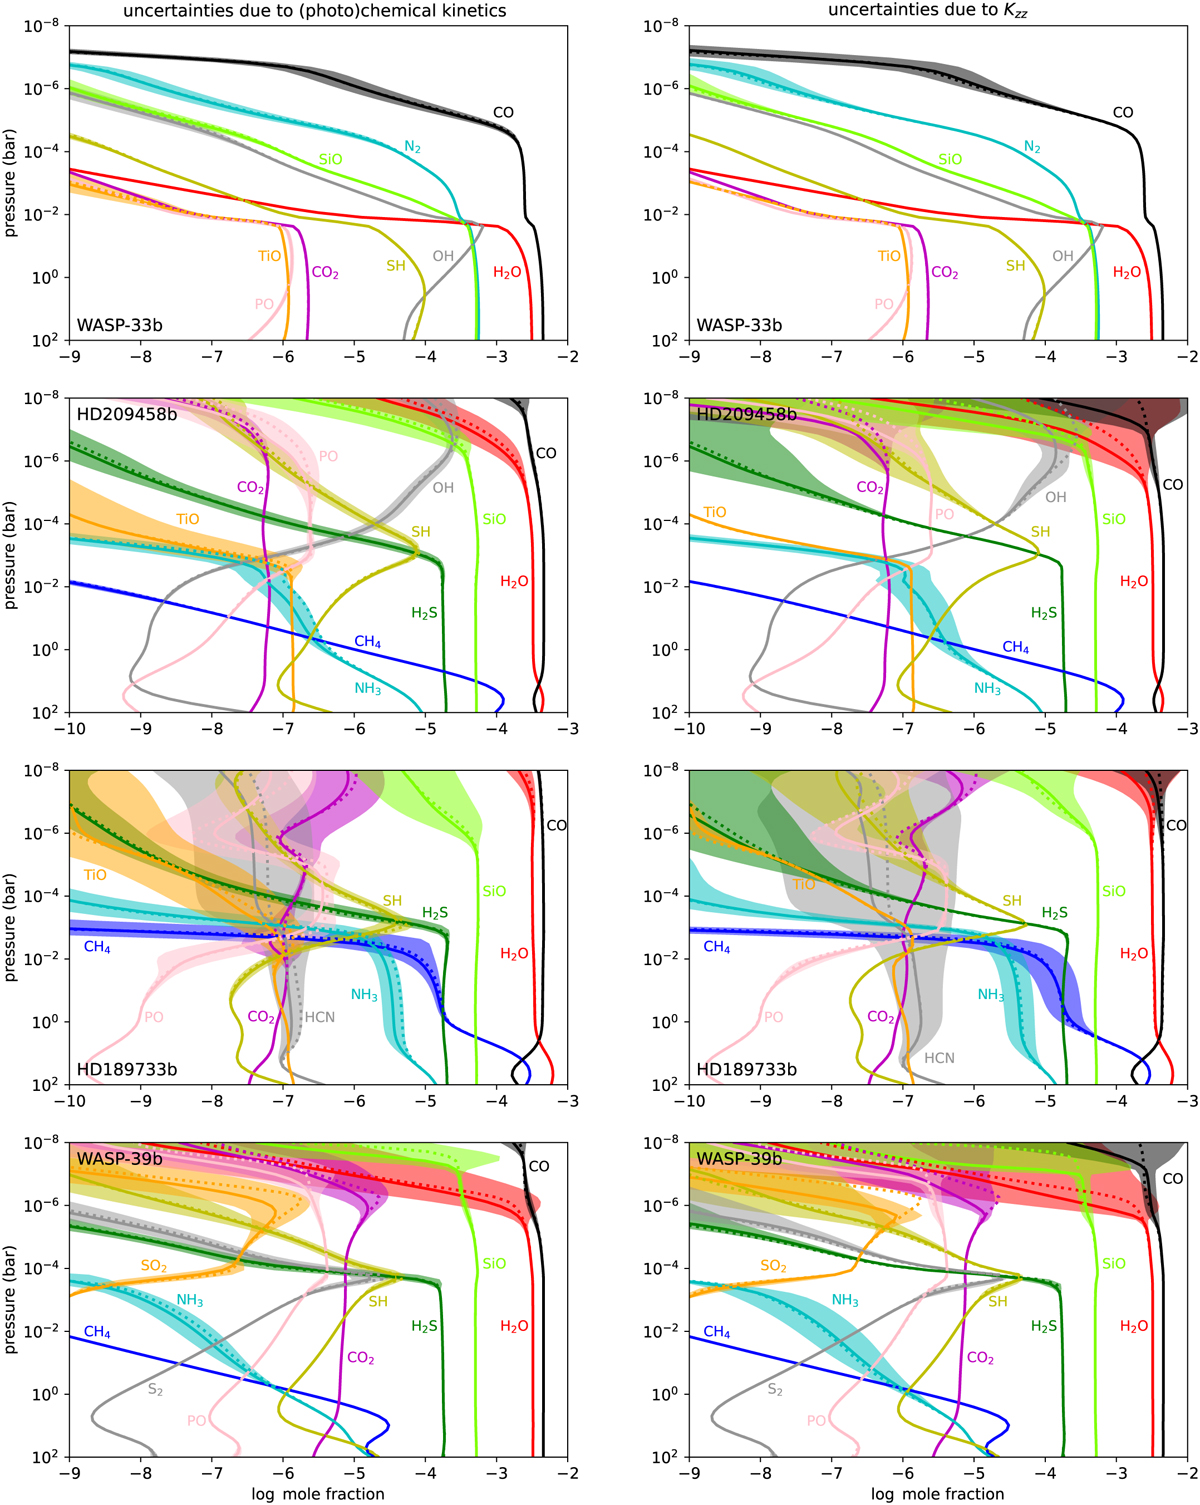
Fig. 3
Download original image
Calculated vertical distribution of abundances in the ultra-hot Jupiter WASP-33b and the hot Jupiters HD 209458b, HD 189733b, and WASP-39b. The solid lines correspond to the mean abundance, the shaded areas to the range around the mean ±σ, and the dotted lines to the abundances resulting from the unperturbed model. The panels on the left show the effect on the calculated abundances of the uncertainties on (photo)chemical kinetics, while the right panels correspond to the effect on the abundances of the uncertainty in Kzz.
Current usage metrics show cumulative count of Article Views (full-text article views including HTML views, PDF and ePub downloads, according to the available data) and Abstracts Views on Vision4Press platform.
Data correspond to usage on the plateform after 2015. The current usage metrics is available 48-96 hours after online publication and is updated daily on week days.
Initial download of the metrics may take a while.