Fig. 1.
Download original image
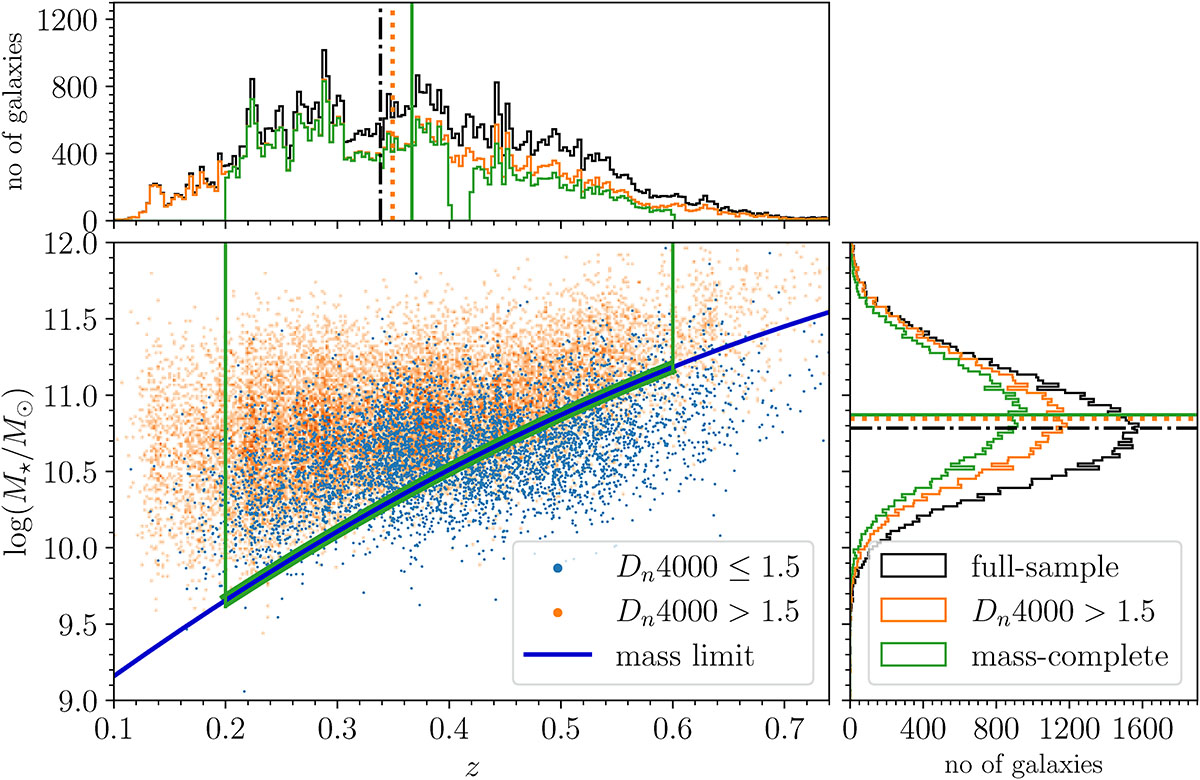
Stellar mass and redshift of HectoMAP galaxies. Blue and orange points in the central panel show M★ as a function of z for the HectoMAP subsample of color-selected galaxies with measured M★. The orange points show HectoMAP quiescent galaxies (Dn4000 > 1.5). The blue line indicates the stellar mass limit as a function of redshift based on the survey magnitude limit. Quiescent (orange) galaxies within the region outlined by green solid lines are included in the mass-complete quiescent sample. The upper and right panels respectively show the marginal distributions in z and M★ for the full (black), quiescent (orange), and mass-complete (green) HectoMAP samples. In these panels, the black dash-dotted, orange dotted, and green solid lines indicate medians of the correspondingly colored distributions. To improve readability in the central panel we show only a randomly selected 30% of the total galaxy sample. Marginal distributions refer to the total samples.
Current usage metrics show cumulative count of Article Views (full-text article views including HTML views, PDF and ePub downloads, according to the available data) and Abstracts Views on Vision4Press platform.
Data correspond to usage on the plateform after 2015. The current usage metrics is available 48-96 hours after online publication and is updated daily on week days.
Initial download of the metrics may take a while.