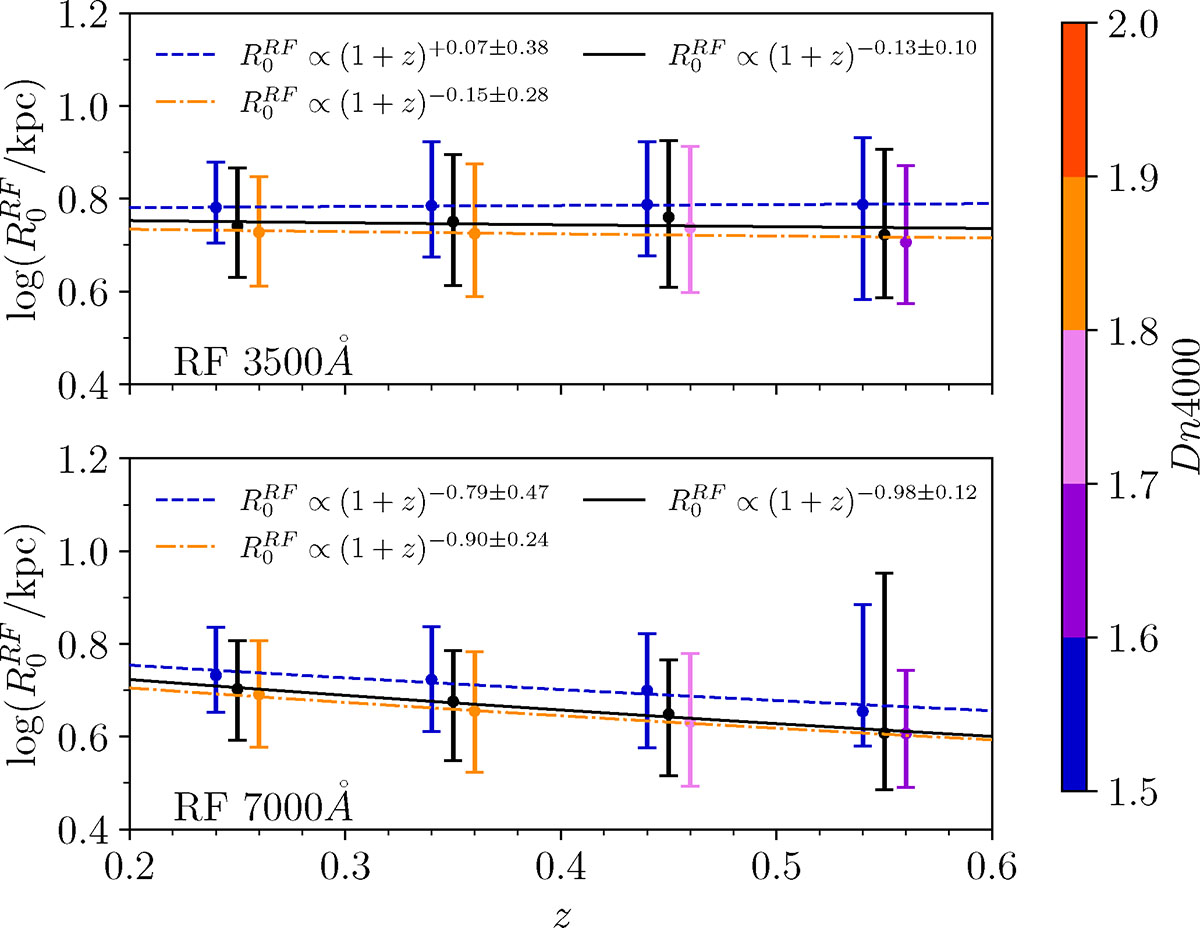
Fig. 10.
Download original image
Redshift evolution of the zero point of the size–stellar mass relation (i.e., log(Re/1 kpc) at the reference stellar mass of 1011 M⊙) as a function of Dn4000. The top and bottom panels show the results in the UV and red rest frames, respectively. Black points show the median size of the total sample of galaxies, and the sets of colder and warmer points show the zero points for the subpopulations of newcomers and aging galaxies, respectively. The colors of symbols for the two subpopulations correspond to their median Dn4000. The error bars denote the 25th–75th percentile range of the distribution. The dashed blue and dash-dotted orange lines are power law fits to the evolution of the zero point of the subpopulations of newcomers and aging galaxies, respectively.
Current usage metrics show cumulative count of Article Views (full-text article views including HTML views, PDF and ePub downloads, according to the available data) and Abstracts Views on Vision4Press platform.
Data correspond to usage on the plateform after 2015. The current usage metrics is available 48-96 hours after online publication and is updated daily on week days.
Initial download of the metrics may take a while.