Fig. A.1.
Download original image
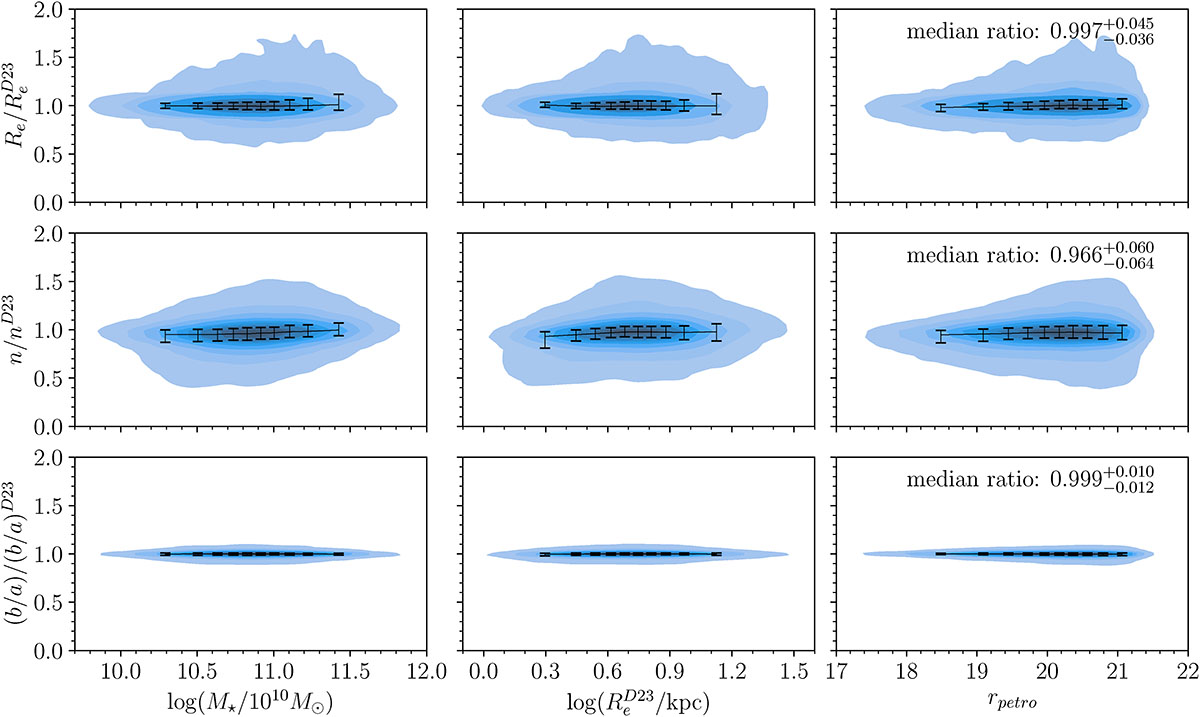
Comparison with previous measurements for HectoMAP galaxies in i−band. The upper row shows the ratio between our Re SourceXtractor++ measurements and the corresponding size ![]() obtained by (Damjanov et al. 2023) using the SExtractor software. The middle and lower rows show the same, but for n and b/a, respectively. From left to right, the panels show the dependence on M★,
obtained by (Damjanov et al. 2023) using the SExtractor software. The middle and lower rows show the same, but for n and b/a, respectively. From left to right, the panels show the dependence on M★, ![]() , and rpetro. Blue regions show the density distribution obtained with a Gaussian kernel estimator. The darkest (smallest) region encloses the 10% of the sample, while the lightest (broadest) region includes the 90% of the sample; successive levels are separated by equal increases of +10% of the total sample. The black lines connect the medians of the ratios in ten equally sampled bins of the corresponding x-axis. Error bars show the interquartile range of the corresponding bin.
, and rpetro. Blue regions show the density distribution obtained with a Gaussian kernel estimator. The darkest (smallest) region encloses the 10% of the sample, while the lightest (broadest) region includes the 90% of the sample; successive levels are separated by equal increases of +10% of the total sample. The black lines connect the medians of the ratios in ten equally sampled bins of the corresponding x-axis. Error bars show the interquartile range of the corresponding bin.
Current usage metrics show cumulative count of Article Views (full-text article views including HTML views, PDF and ePub downloads, according to the available data) and Abstracts Views on Vision4Press platform.
Data correspond to usage on the plateform after 2015. The current usage metrics is available 48-96 hours after online publication and is updated daily on week days.
Initial download of the metrics may take a while.