Fig. 5.
Download original image
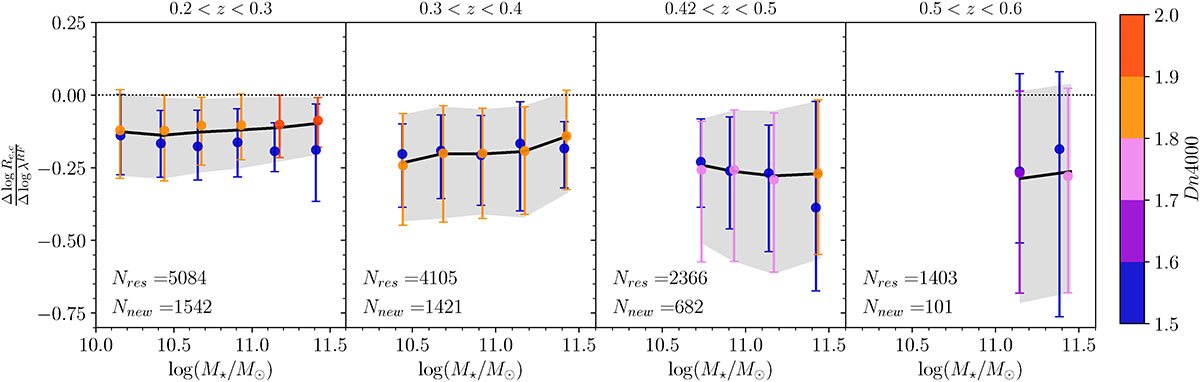
![]() as a function of stellar mass and Dn4000 for two quiescent subpopulations. Circles show the median rate of change in size with rest-frame wavelength for the subpopulations of aging galaxies (shades of purple and red) and newcomers (blue) in Δ[log(M★/M⊙)] = 0.25 bins of stellar mass. The color of the symbols corresponds to the median Dn4000 index of the subpopulation. The panels show the four Δz = 0.1 intermediate redshift bins (as indicated in the panel legends). Error bars denote the interquartile range of the correspondingly colored population. Colors indicate Dn4000. The black curve in each panel shows the median rate of change in size with rest-frame wavelength of the total quiescent population (same as Fig. 3) and the gray area shows the corresponding interquartile range.
as a function of stellar mass and Dn4000 for two quiescent subpopulations. Circles show the median rate of change in size with rest-frame wavelength for the subpopulations of aging galaxies (shades of purple and red) and newcomers (blue) in Δ[log(M★/M⊙)] = 0.25 bins of stellar mass. The color of the symbols corresponds to the median Dn4000 index of the subpopulation. The panels show the four Δz = 0.1 intermediate redshift bins (as indicated in the panel legends). Error bars denote the interquartile range of the correspondingly colored population. Colors indicate Dn4000. The black curve in each panel shows the median rate of change in size with rest-frame wavelength of the total quiescent population (same as Fig. 3) and the gray area shows the corresponding interquartile range.
Current usage metrics show cumulative count of Article Views (full-text article views including HTML views, PDF and ePub downloads, according to the available data) and Abstracts Views on Vision4Press platform.
Data correspond to usage on the plateform after 2015. The current usage metrics is available 48-96 hours after online publication and is updated daily on week days.
Initial download of the metrics may take a while.