Open Access
Fig. 7.
Download original image
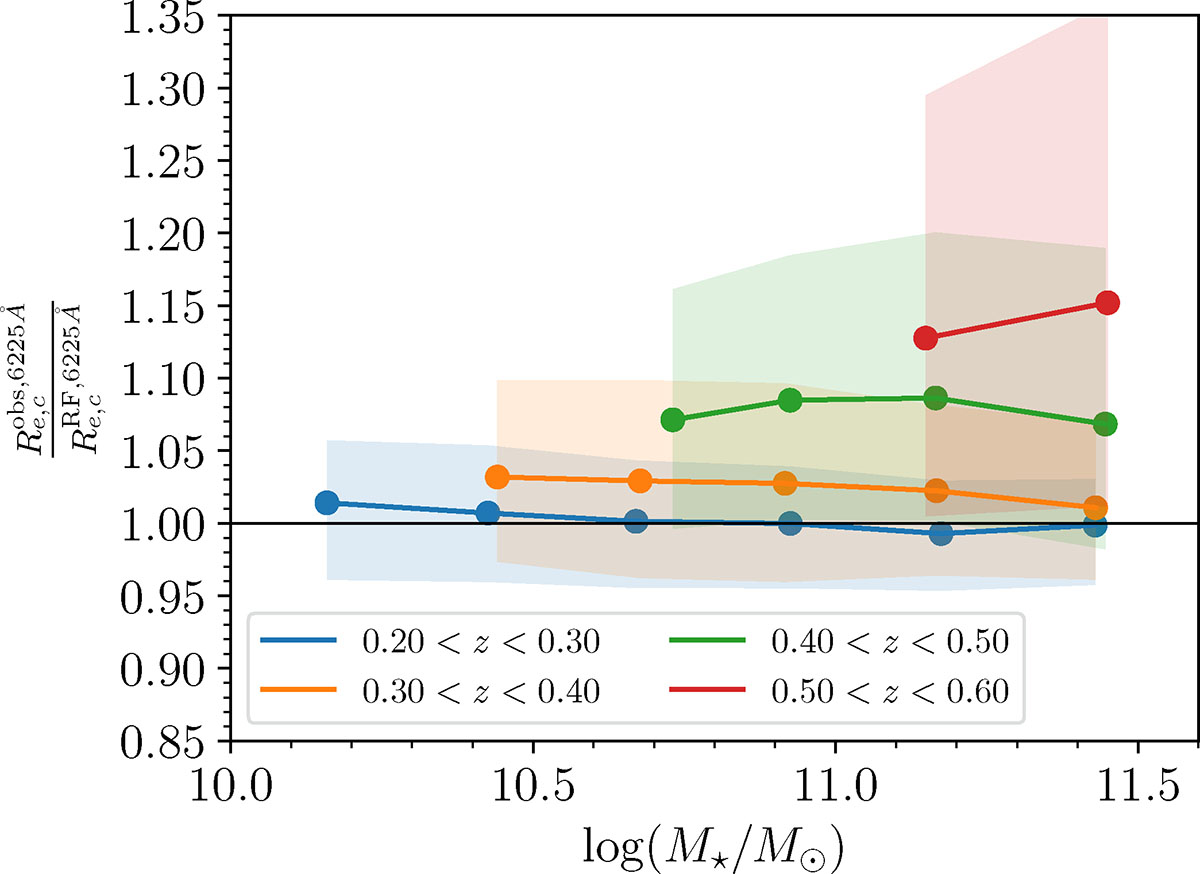
Ratio between sizes measured in the observed r-band wavelength and in the rest-frame r band. Points show the median ratios in equally spaced mass bins. Color-coding refers to the four redshift bins in the legend. The shadowed areas indicate the interquartile range of the ratios.
Current usage metrics show cumulative count of Article Views (full-text article views including HTML views, PDF and ePub downloads, according to the available data) and Abstracts Views on Vision4Press platform.
Data correspond to usage on the plateform after 2015. The current usage metrics is available 48-96 hours after online publication and is updated daily on week days.
Initial download of the metrics may take a while.