Fig. 9.
Download original image
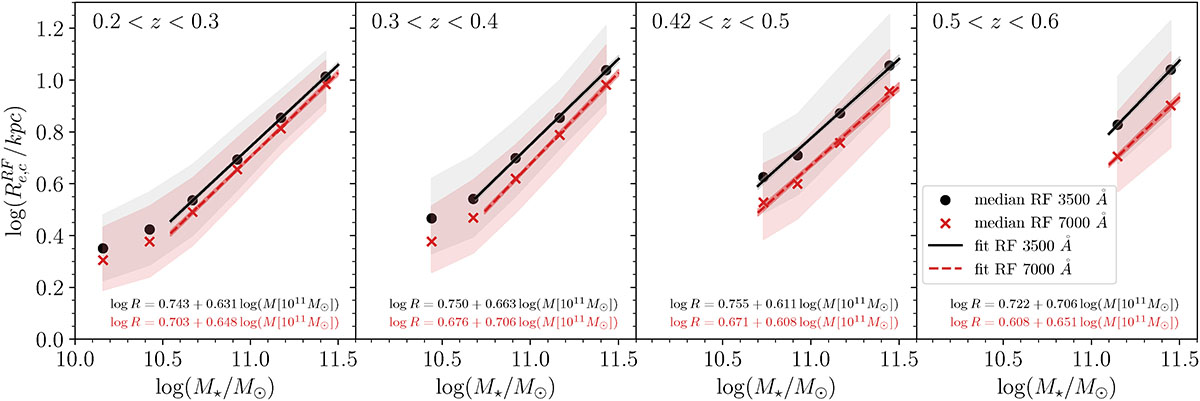
Size–stellar mass relation for quiescent galaxies in two rest frames. The black points and red crosses show the median galaxy size (log scale) for the central values of equally spaced stellar mass bins in the two rest frames 3500 Å and 7000 Å respectively. The panels show four redshift bins with redshift increasing from left to right. The black solid and red dashed lines show the linear fit to the medians, and the thickness of dark gray and red bands around them corresponds to the uncertainties. The shaded bands represent the interquartile ranges of galaxy sizes across stellar mass bins.
Current usage metrics show cumulative count of Article Views (full-text article views including HTML views, PDF and ePub downloads, according to the available data) and Abstracts Views on Vision4Press platform.
Data correspond to usage on the plateform after 2015. The current usage metrics is available 48-96 hours after online publication and is updated daily on week days.
Initial download of the metrics may take a while.