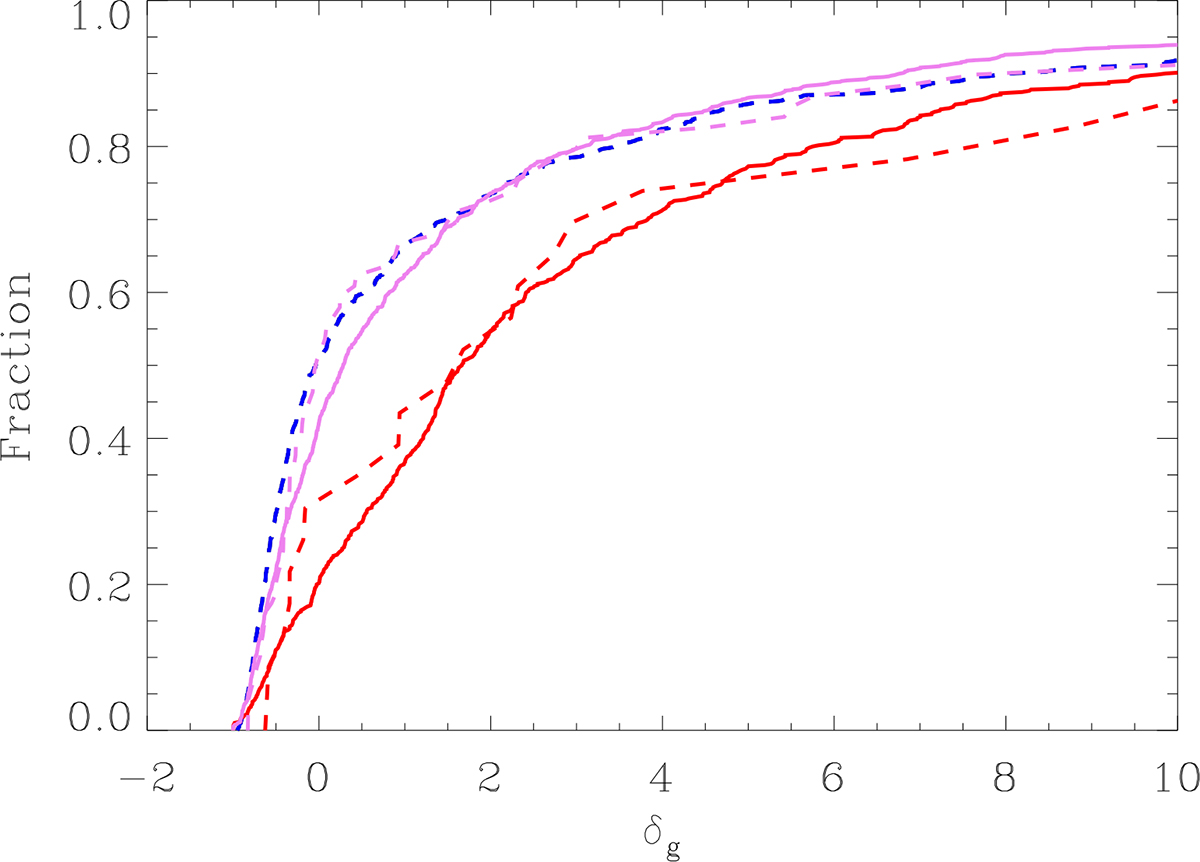
Fig. 2.
Download original image
Cumulative distribution function of the local galaxy overdensity of different galaxy subsamples defined in this work, calculated following Zarattini & Aguerri (2025). The solid lines show the behavior of all the cluster (red), and filament (violet) galaxies included in Castignani et al. (2022)’s work (barred or not). The dashed lines show the behavior of the morphologically selected barred galaxies, which have been obtained from Walmsley et al. (2023) and adopted in this study. The dashed red, violet, and blue lines mark the cluster, filament and field barred galaxies, respectively.
Current usage metrics show cumulative count of Article Views (full-text article views including HTML views, PDF and ePub downloads, according to the available data) and Abstracts Views on Vision4Press platform.
Data correspond to usage on the plateform after 2015. The current usage metrics is available 48-96 hours after online publication and is updated daily on week days.
Initial download of the metrics may take a while.