Fig. 3.
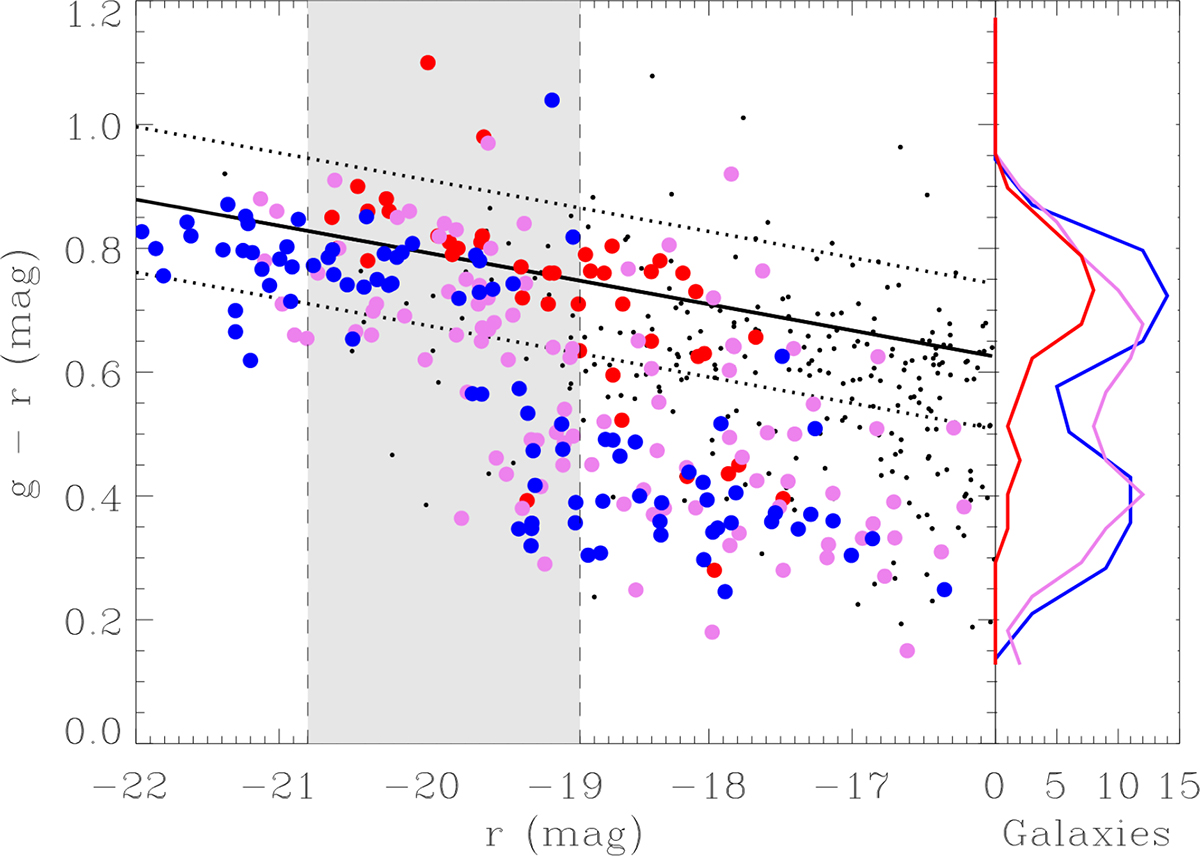
Download original image
Left panel: Color–magnitude diagram of barred galaxies located in the Virgo cluster (red points), filaments (violet points), and field (blue points), selected as described in Sect. 2.2. Non-barred galaxies hosted in the Virgo cluster from Castignani et al. (2022) are marked as well (black points). The solid line shows the best fit to the red sequence of Virgo cluster galaxies, while the dotted lines indicate the 1σ uncertainty of the fit. The shaded gray area represents the selected luminosity range of the galaxies. Right panel: g − r stellar color distribution of the galaxies located in the cluster (red line), filament (violet line) and field (blue line).
Current usage metrics show cumulative count of Article Views (full-text article views including HTML views, PDF and ePub downloads, according to the available data) and Abstracts Views on Vision4Press platform.
Data correspond to usage on the plateform after 2015. The current usage metrics is available 48-96 hours after online publication and is updated daily on week days.
Initial download of the metrics may take a while.