Fig. 1.
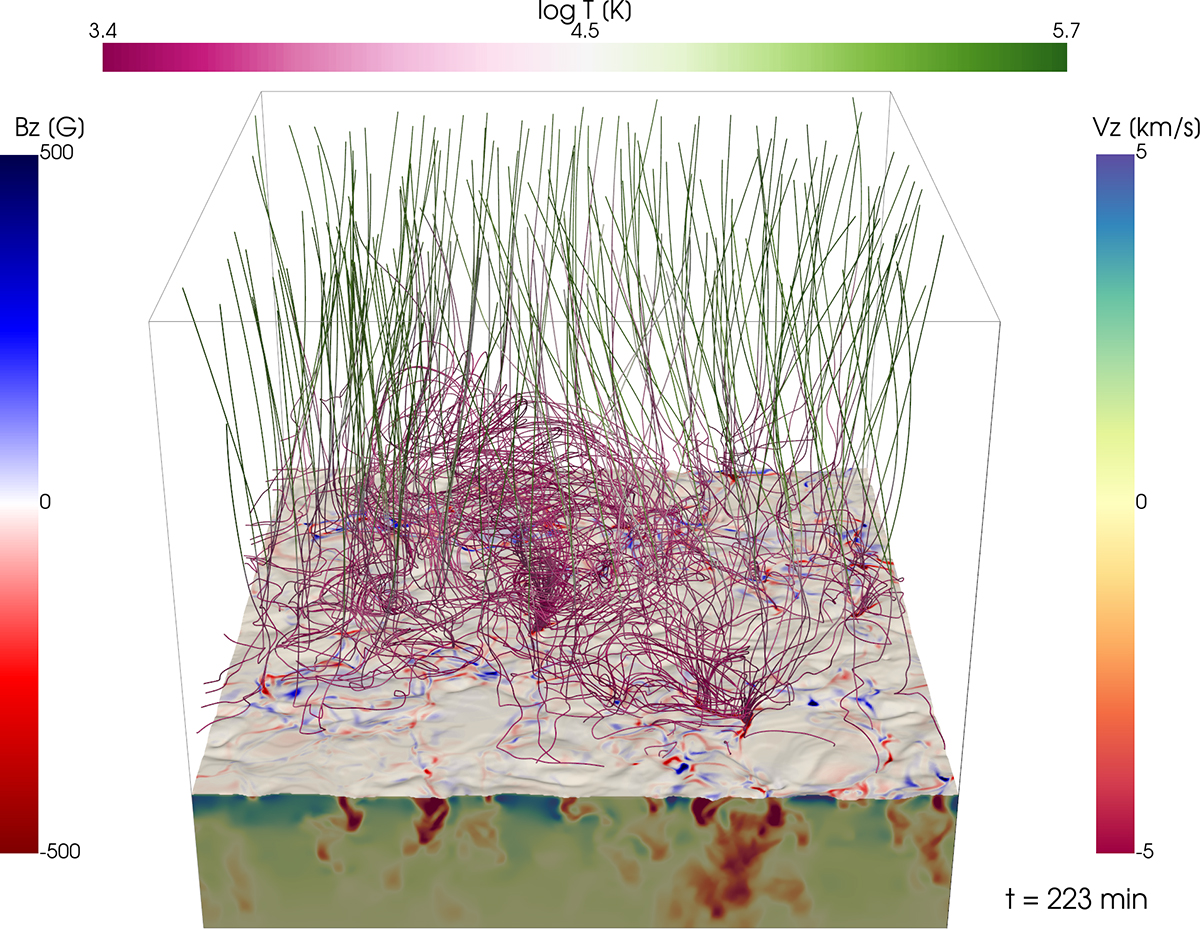
Download original image
3D visualisation of ch012023. The horizontal, corrugated slice represents the τ500 = 1 surface, coloured by the photospheric vertical magnetic field Bz. Vertical convective velocities vz are illustrated at the side of the upper convection zone, and magnetic field lines are coloured with temperatures. Fifteen-by-fifteen seeds have been uniformly distributed horizontally at 3 Mm to trace the magnetic field lines, which connect to different structures, primarily magnetic concentrations located in intergranular lanes at the photosphere. Magnetic field lines are coloured by temperature, ranging from pink in the temperature minimum region of the chromosphere (∼4000 K), to white in the TR (∼40 000 K), and green when reaching the low corona at the top of our box (∼500 000 K). Note the vortex-like pink feature at the middle of the box, known as a ‘magnetic tornado’. An animation covering 12 s, (30 solar minutes) is available online.
Current usage metrics show cumulative count of Article Views (full-text article views including HTML views, PDF and ePub downloads, according to the available data) and Abstracts Views on Vision4Press platform.
Data correspond to usage on the plateform after 2015. The current usage metrics is available 48-96 hours after online publication and is updated daily on week days.
Initial download of the metrics may take a while.