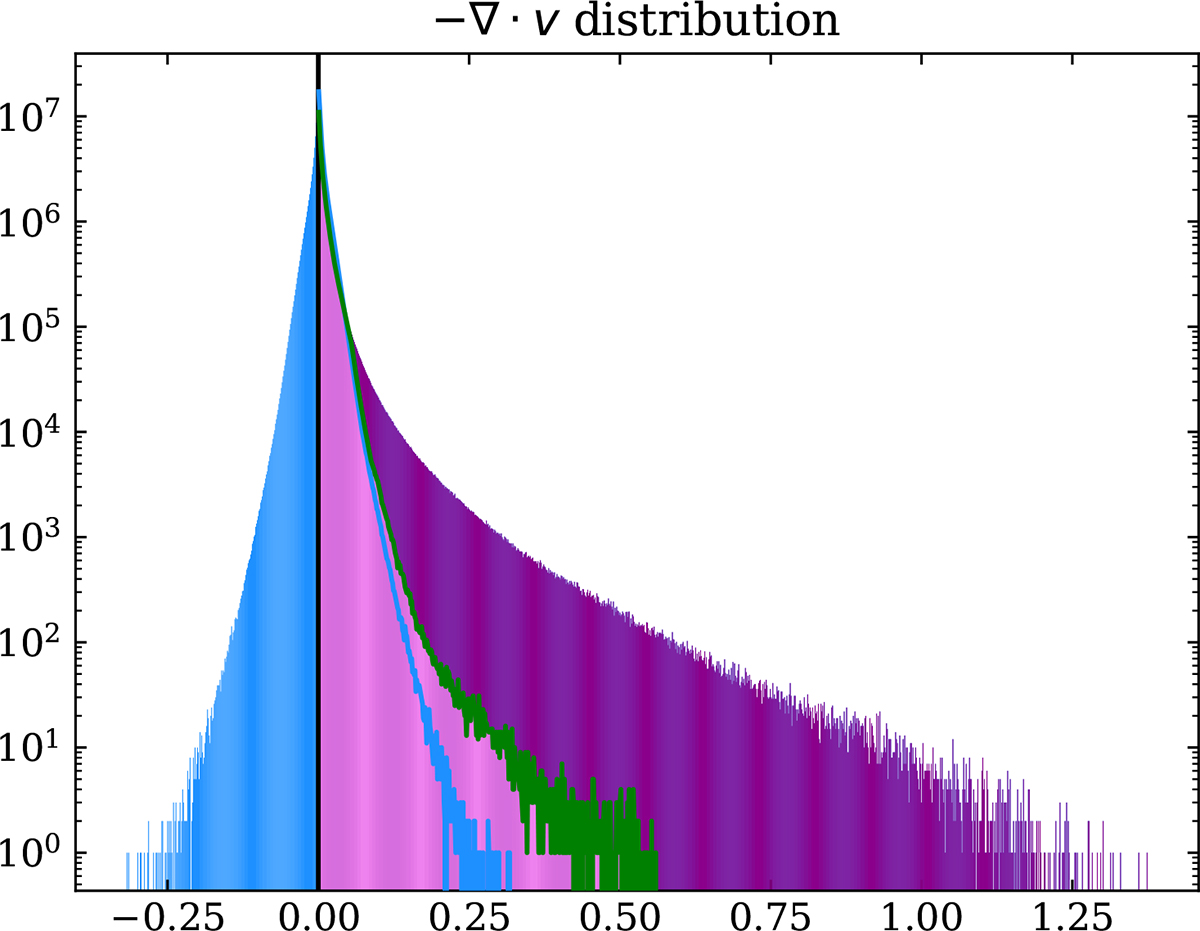
Fig. B.1.
Download original image
Histogram of the compression frequency −∇ ⋅ v in the entire domain. The negative (positive) frequency population represents expansions (compressions) and is coloured in blue (magenta). The green line represents the histogram of compression frequencies corresponding to ![]() , with ϵ = 6 (see Eq. 1)). We use a darker shade of magenta to highlight compressions attributed to non-linear shocks.
, with ϵ = 6 (see Eq. 1)). We use a darker shade of magenta to highlight compressions attributed to non-linear shocks.
Current usage metrics show cumulative count of Article Views (full-text article views including HTML views, PDF and ePub downloads, according to the available data) and Abstracts Views on Vision4Press platform.
Data correspond to usage on the plateform after 2015. The current usage metrics is available 48-96 hours after online publication and is updated daily on week days.
Initial download of the metrics may take a while.