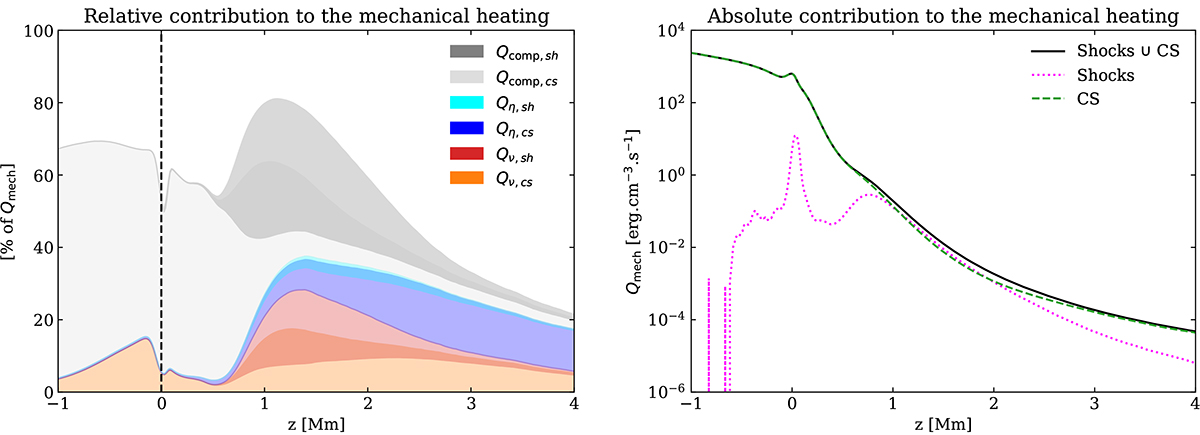
Fig. B.2.
Download original image
Left: Stack plot of the relative contributions of shocks, CSs, and non-steep gradients (white), corresponding to the right panel of Fig. 9. The colour code of the different relative contributions to the mechanical heating (Qmech = Qcomp + Qν + Qη) is the same as for Figs. 7 and 9. Similarly, these contributions have been averaged in space horizontally and in time over 1 solar hour. Right: Absolute contribution of shocks (dotted magenta), CSs (dashed green), and the union of both (solid dark) to the mechanical heating.
Current usage metrics show cumulative count of Article Views (full-text article views including HTML views, PDF and ePub downloads, according to the available data) and Abstracts Views on Vision4Press platform.
Data correspond to usage on the plateform after 2015. The current usage metrics is available 48-96 hours after online publication and is updated daily on week days.
Initial download of the metrics may take a while.