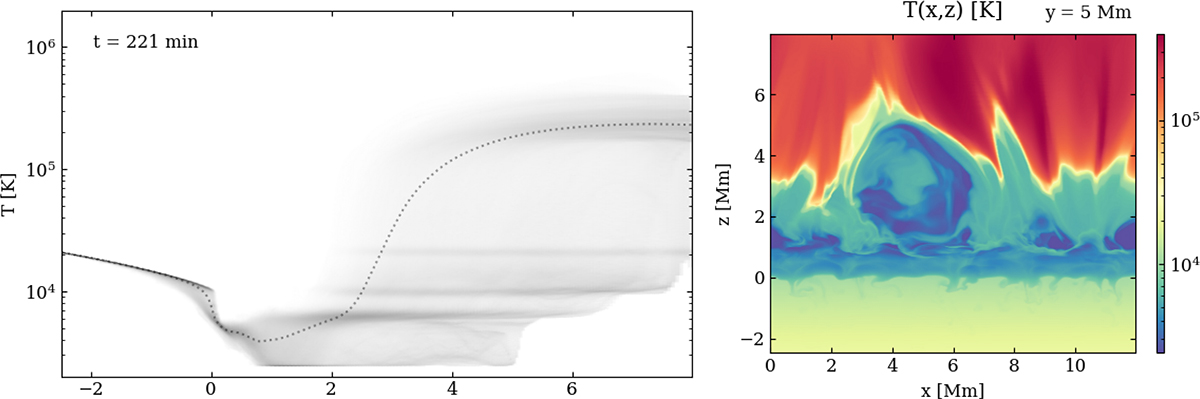
Fig. 2.
Download original image
Temperature distribution. Left: PDF of the temperature as a function of height. The horizontally averaged mean temperature profile is marked with a dotted line. Note the logarithmic temperature scale. Right: Vertical cut in the middle of the domain of the temperature map. Note the 2D cut of the vortex-like structure highlighted in Fig. 1 between x = 3 and 7 Mm, along with spicular structures, notably at x = 8 Mm, propagating chromospheric temperatures into the TR. An animation covering 71 s, corresponding to 2 solar hours, is available online.
Current usage metrics show cumulative count of Article Views (full-text article views including HTML views, PDF and ePub downloads, according to the available data) and Abstracts Views on Vision4Press platform.
Data correspond to usage on the plateform after 2015. The current usage metrics is available 48-96 hours after online publication and is updated daily on week days.
Initial download of the metrics may take a while.