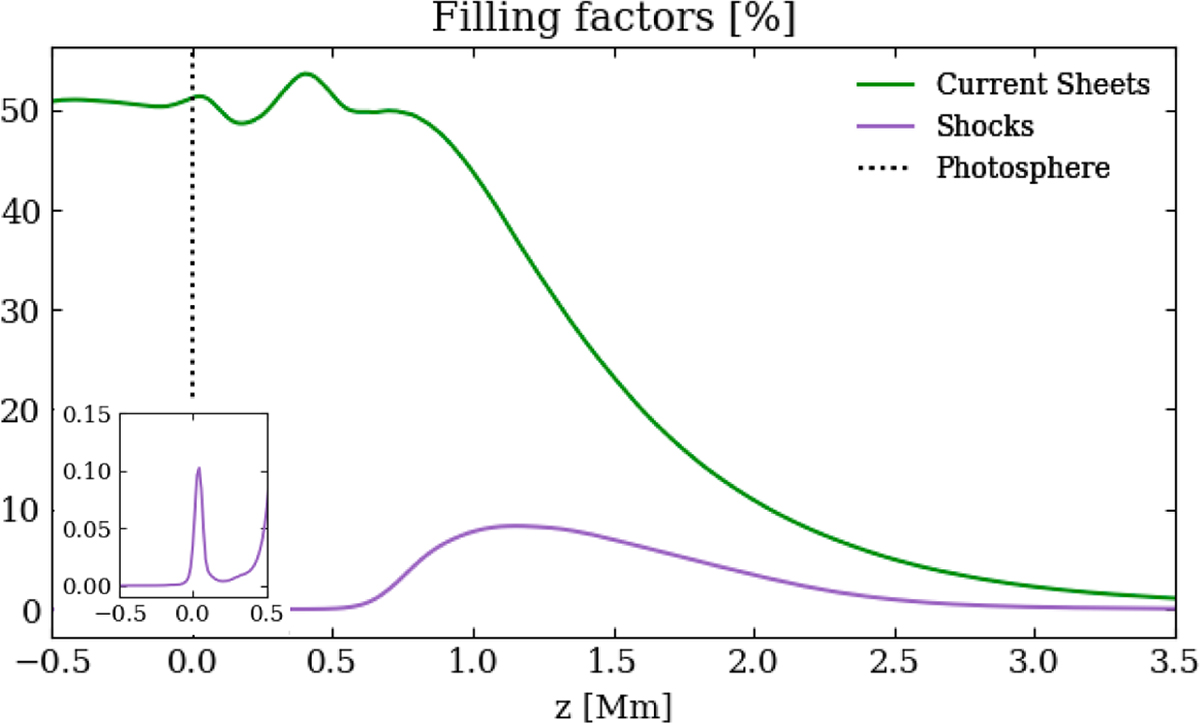
Fig. 5.
Download original image
Fractional number of grid cells labelled as shocks (purple line) or CSs (green line) as a function of height. An vertical dotted line marks the position z = 0 Mm (the bottom of the photosphere), and a zoom-in is provided to catch the small peak in the shocks filling factor at this location. These curves are averaged over one hour in time and horizontally in space.
Current usage metrics show cumulative count of Article Views (full-text article views including HTML views, PDF and ePub downloads, according to the available data) and Abstracts Views on Vision4Press platform.
Data correspond to usage on the plateform after 2015. The current usage metrics is available 48-96 hours after online publication and is updated daily on week days.
Initial download of the metrics may take a while.