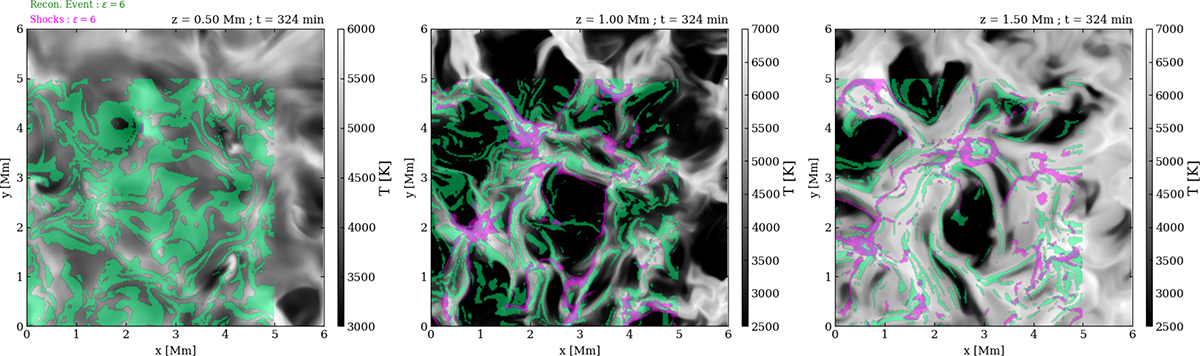
Fig. 6.
Download original image
Interplay of shocks (purple) and CSs (green) with temperature structures in the chromosphere (greyscale colour bar). A zoom-in on a 6 × 6 Mm2 area is shown to emphasise the chromospheric structures. Shock and CS overlay are only considered on a 5 × 5 Mm2 portion of the panels, to clearly illustrate the overlap between high-gradient processes and temperature structures. An animation covering 29 s (48 solar minutes) is available online.
Current usage metrics show cumulative count of Article Views (full-text article views including HTML views, PDF and ePub downloads, according to the available data) and Abstracts Views on Vision4Press platform.
Data correspond to usage on the plateform after 2015. The current usage metrics is available 48-96 hours after online publication and is updated daily on week days.
Initial download of the metrics may take a while.