Fig. 8.
Download original image
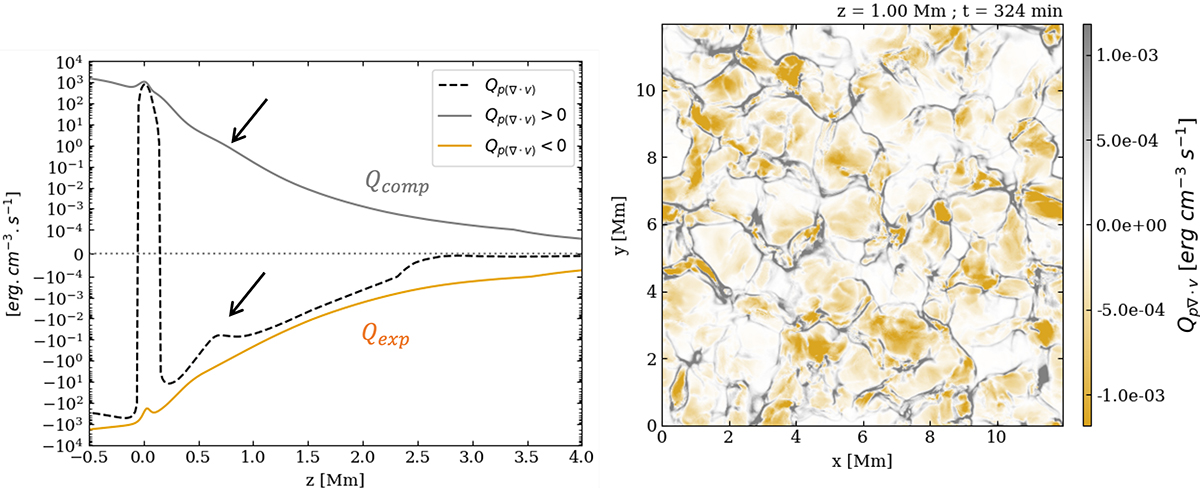
Spatial distribution of the compressible term Qp∇⋅v = −p∇ ⋅ v from the internal energy equation. Left: Vertical profile indicated with a dashed black curve from the sub-surface CZ to the TR. Both the positive (heating via compression Qcomp) and negative (cooling via expansion Qexp) contributions of this term are illustrated with a grey and solid gold line, respectively. All profiles are averaged horizontally in space and over 1 solar hour in time. The dark arrows point to the local increase in Qp∇⋅v, due to the change in behaviour of Qcomp, resulting from upward-propagating waves that shock in the lower chromosphere. Right: Horizontal cut of Qp∇⋅v at z = 1 Mm. Grey and gold regions illustrate heating via compression and cooling via expansion, respectively. The limits of the colour bar correspond to twice the standard deviation of this map. An animation covering 17 s (27 solar minutes) is available online.
Current usage metrics show cumulative count of Article Views (full-text article views including HTML views, PDF and ePub downloads, according to the available data) and Abstracts Views on Vision4Press platform.
Data correspond to usage on the plateform after 2015. The current usage metrics is available 48-96 hours after online publication and is updated daily on week days.
Initial download of the metrics may take a while.