Fig. 9.
Download original image
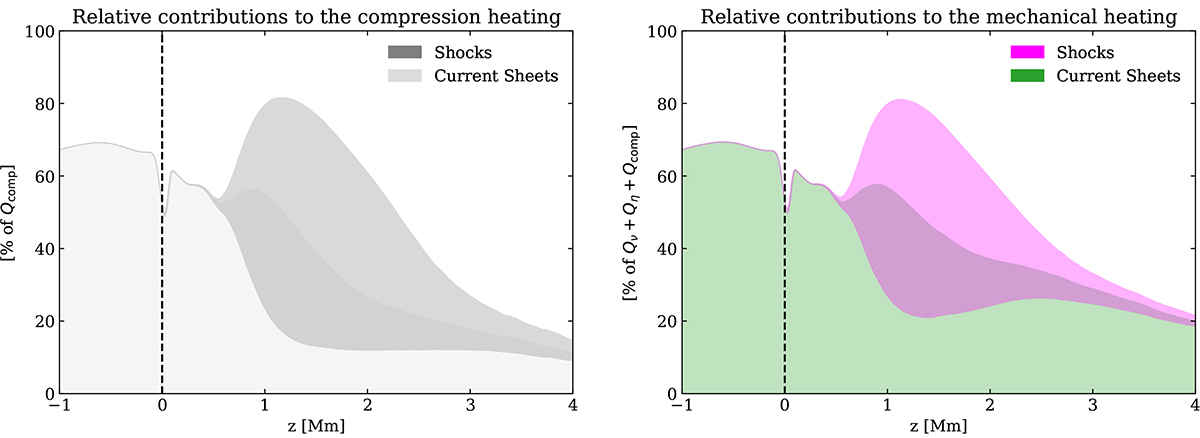
Vertical profiles of the relative contributions of shocks and CSs. Profiles are averaged horizontally in space and over 1 solar hour in time. At each height, we sum either Qcomp (left) or Qmech = Qν + Qη + Qcomp (right) over a selected subset of the domain (shocks, CSs, or the intersection of both) and compare it to the sum of the same quantity over the whole horizontal extent at that height. The vertical dashed line indicates the top of the CZ. Left: Relative contribution to the compression heating Qcomp, with shocks in dark grey and CSs in light grey. Right: Similar to the left panel in Fig. 7, but showing summed compression heating from the left panel (see Appendix D for an illustration of the stacking, along with absolute values). Contributions of the shocks, CSs, and non-steep gradients to the mechanical heating Qmech are in purple, green, and white, respectively.
Current usage metrics show cumulative count of Article Views (full-text article views including HTML views, PDF and ePub downloads, according to the available data) and Abstracts Views on Vision4Press platform.
Data correspond to usage on the plateform after 2015. The current usage metrics is available 48-96 hours after online publication and is updated daily on week days.
Initial download of the metrics may take a while.