Fig. 14
Download original image
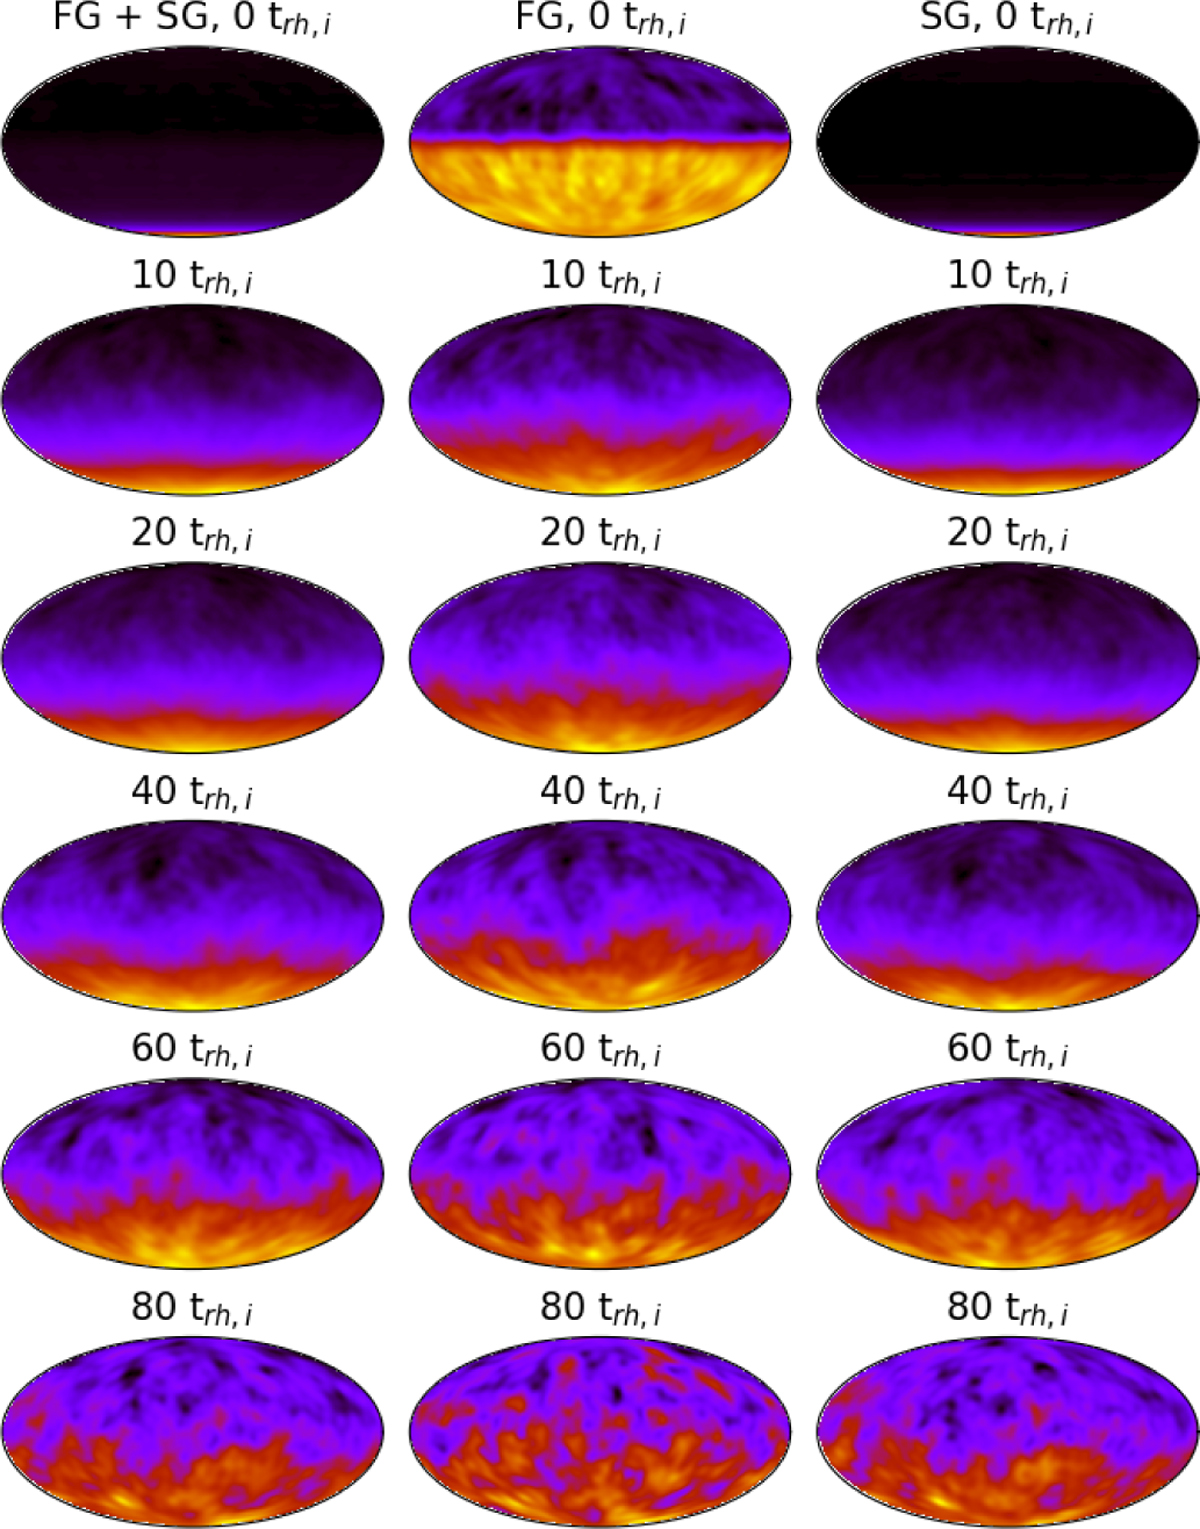
Internal angular momentum maps are shown for FG + SG (left), FG (middle), and SG (right) for the Delta0 model. The colour map corresponds to the concentration of stars whose internal angular momentum points in a given direction. Higher concentrations are represented by a yellow colouration, while lower concentrations are represented by a black colouration. A top-hat smoothing was applied to the density maps. Rows show representative time steps throughout the simulation. The orbital angular momentum vector is aligned with the bottom of the maps.
Current usage metrics show cumulative count of Article Views (full-text article views including HTML views, PDF and ePub downloads, according to the available data) and Abstracts Views on Vision4Press platform.
Data correspond to usage on the plateform after 2015. The current usage metrics is available 48-96 hours after online publication and is updated daily on week days.
Initial download of the metrics may take a while.