Fig. 5
Download original image
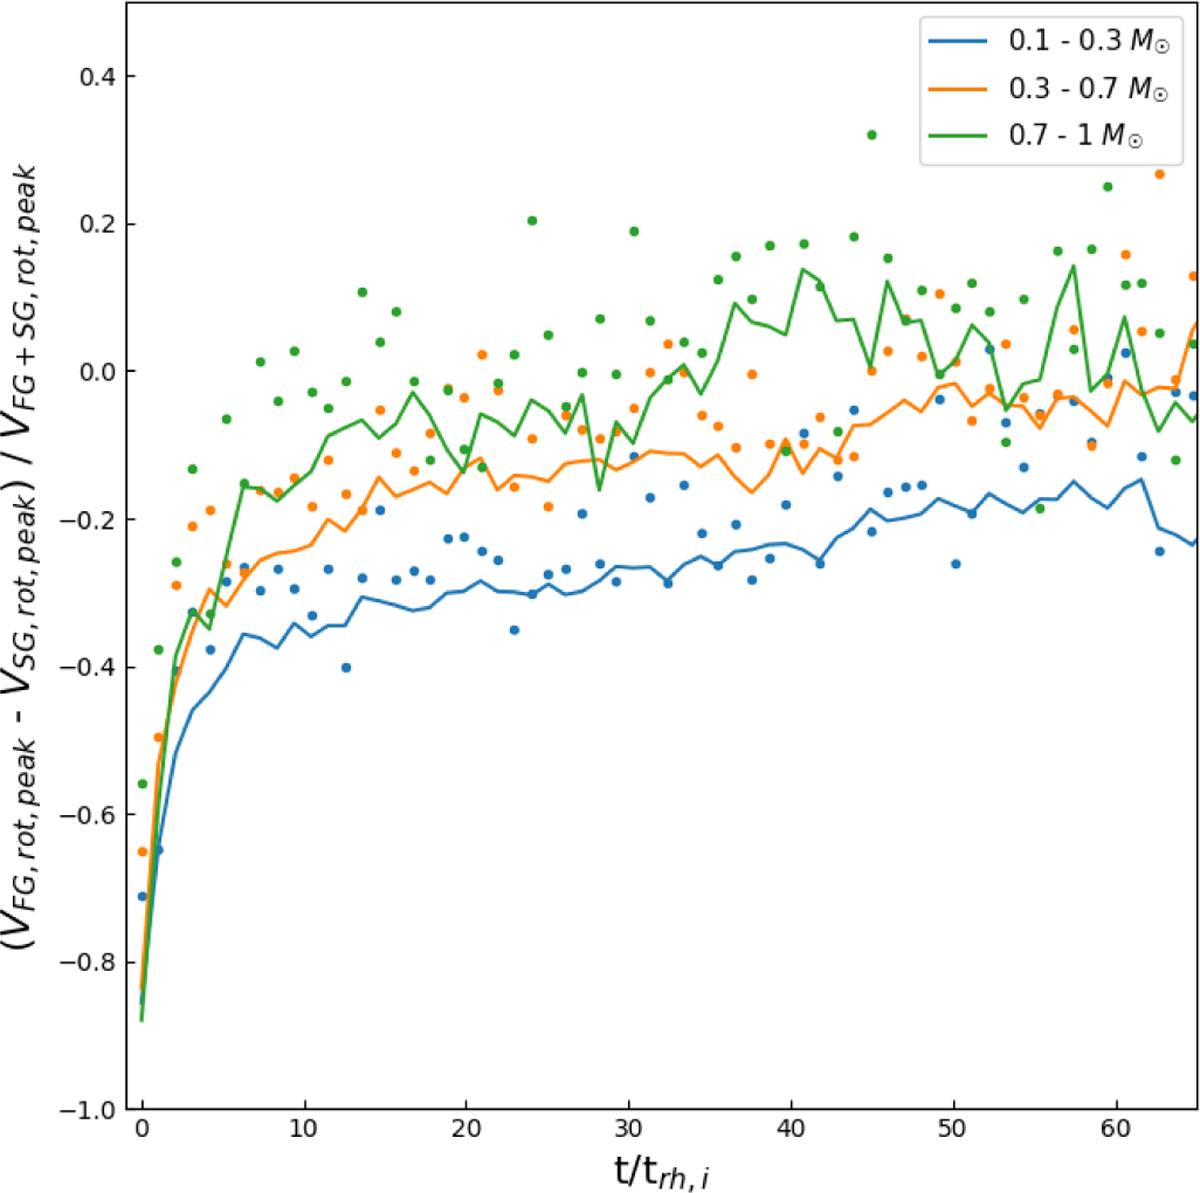
Time evolution of differences between maximum rotational velocities of FG and SG stars is shown for different mass groups. Velocities are normalised by the peak rotational velocity for all stars (FG + SG), computed at each time. Dots correspond to the peak velocity values taken directly from the rotation profiles. Lines represent the peak velocity values taken from best-fit rotation curves to the rotation profiles (as described in Eq. (2)). The time was limited to when simulations had approximately 10% of the initial stars remaining.
Current usage metrics show cumulative count of Article Views (full-text article views including HTML views, PDF and ePub downloads, according to the available data) and Abstracts Views on Vision4Press platform.
Data correspond to usage on the plateform after 2015. The current usage metrics is available 48-96 hours after online publication and is updated daily on week days.
Initial download of the metrics may take a while.