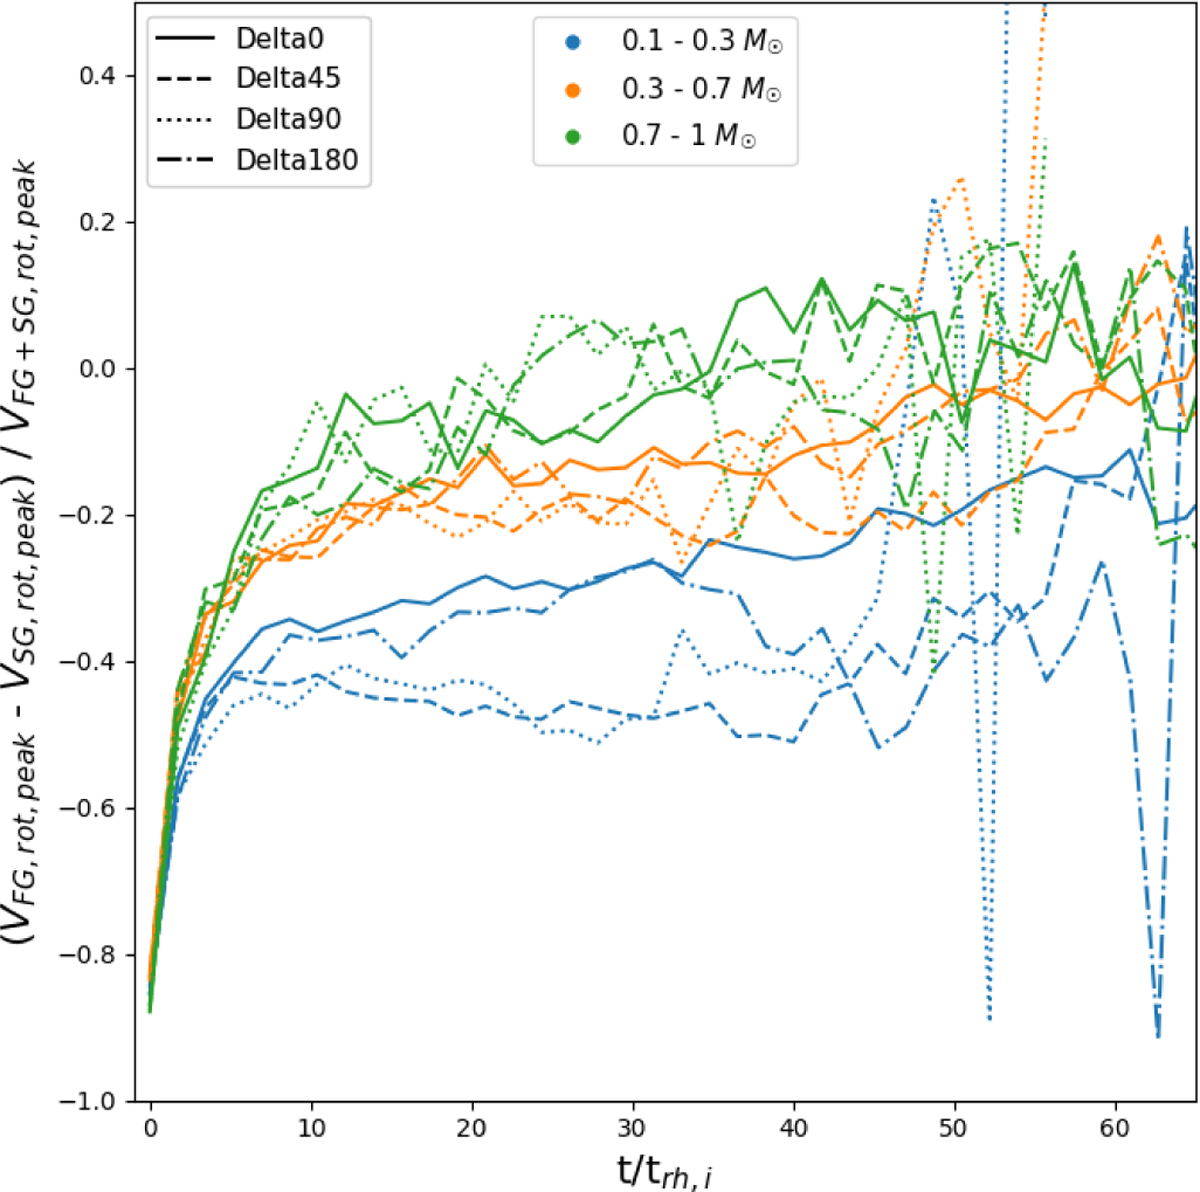
Fig. 8
Download original image
Time evolution of difference between maximum rotational velocities of FG and SG is shown for different models and relevant mass groups. The low-mass bin (0.1-0.3 M⊙) is shown in blue, the intermediate-mass bin (0.3-0.7 M⊙) in orange, and the high-mass bin (0.7-1 M⊙) in green. Delta0 is denoted by a solid line, Delta45 by a dashed line, Delta90 by a dotted line, and Delta180 by a dash-dotted line. For the clarity of the figure, we only show best-fit lines to the data. The largest difference between generations can be seen in the lowest mass bin.
Current usage metrics show cumulative count of Article Views (full-text article views including HTML views, PDF and ePub downloads, according to the available data) and Abstracts Views on Vision4Press platform.
Data correspond to usage on the plateform after 2015. The current usage metrics is available 48-96 hours after online publication and is updated daily on week days.
Initial download of the metrics may take a while.