Fig. 7
Download original image
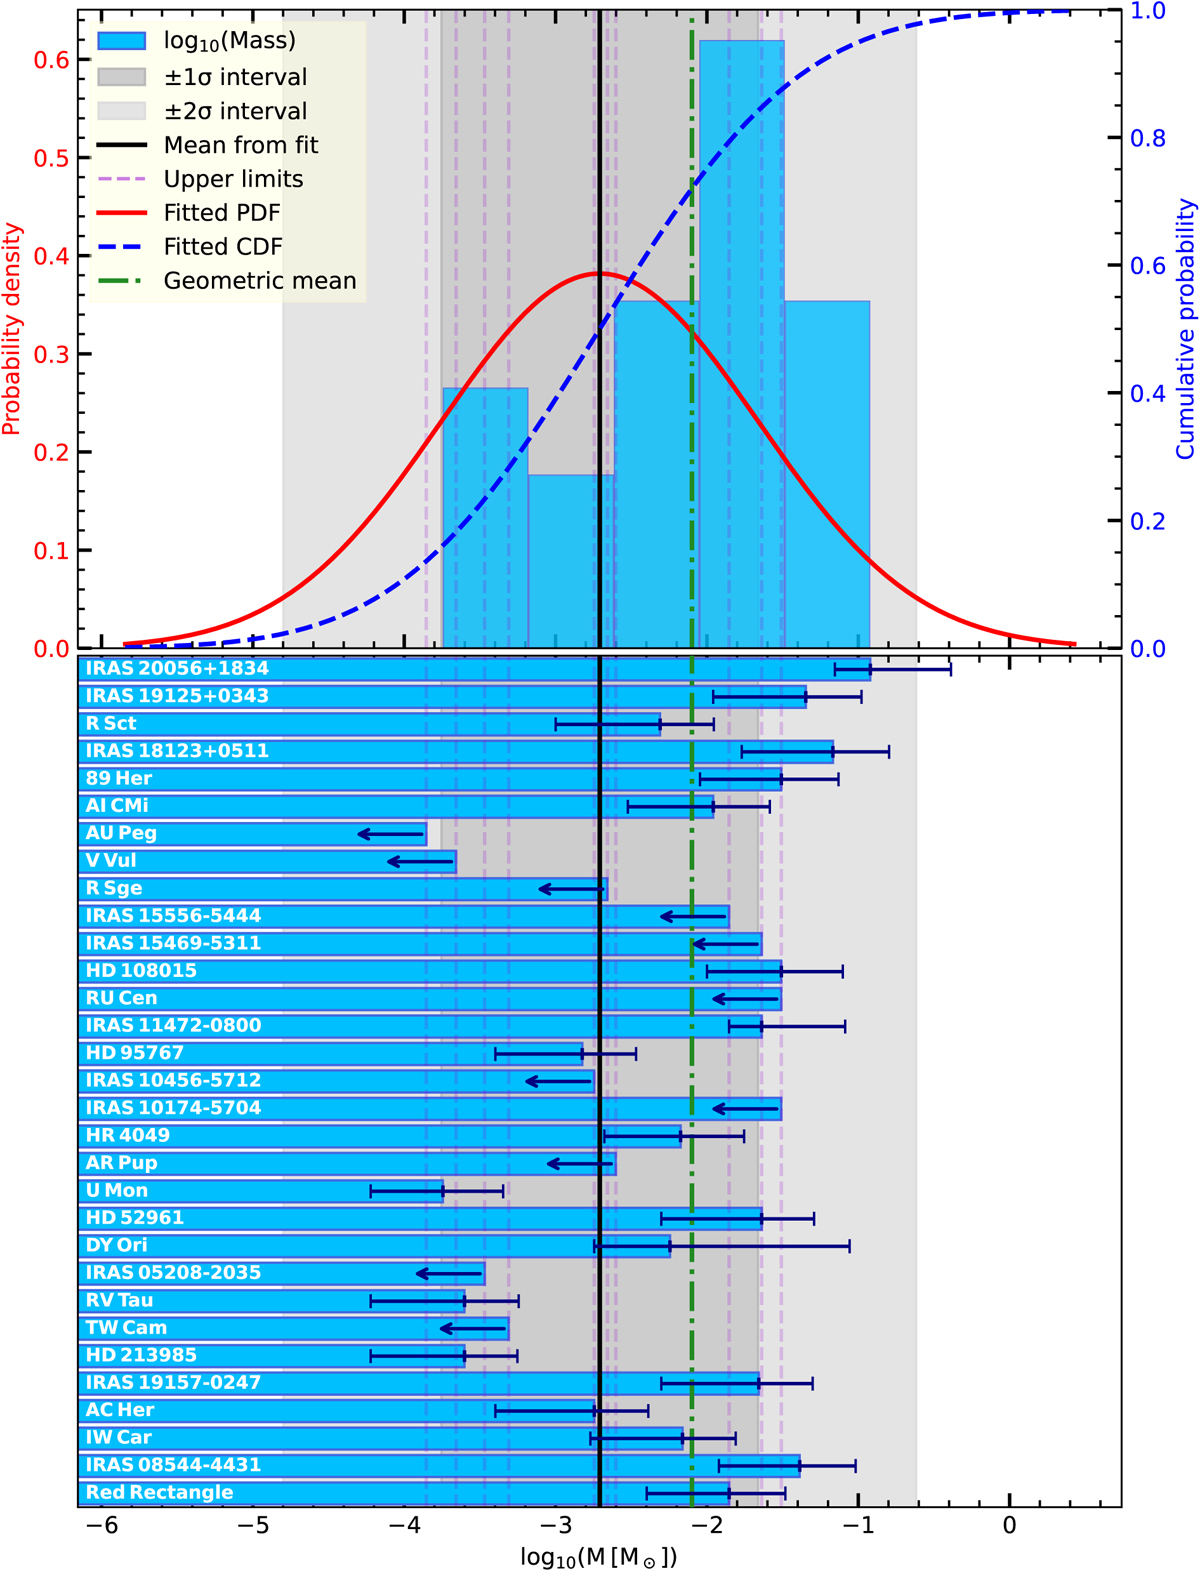
Top panel : histogram of the logarithm of disk masses for detected sources, overlaid with the probability density function (PDF; red line) and cumulative distribution function (CDF; dashed blue line) resulting from a censored normal likelihood fit that accounts for non-detections (upper limits). Shaded gray regions mark the ±1σlog and ±2σlog intervals around the fitted mean (vertical black line). The vertical dash-dotted line shows the geometric mean of the detections (green), while vertical dashed lines indicate the positions of the upper limits (in violet). Bottom panel : representation of individual sources, showing the log-mass of each object. Names appear to the left of each bar. Sources with upper limits are marked with arrows pointing left from their log-mass value. The shaded regions, vertical lines, and color coding are consistent with the top panel.
Current usage metrics show cumulative count of Article Views (full-text article views including HTML views, PDF and ePub downloads, according to the available data) and Abstracts Views on Vision4Press platform.
Data correspond to usage on the plateform after 2015. The current usage metrics is available 48-96 hours after online publication and is updated daily on week days.
Initial download of the metrics may take a while.