Fig. F.4
Download original image
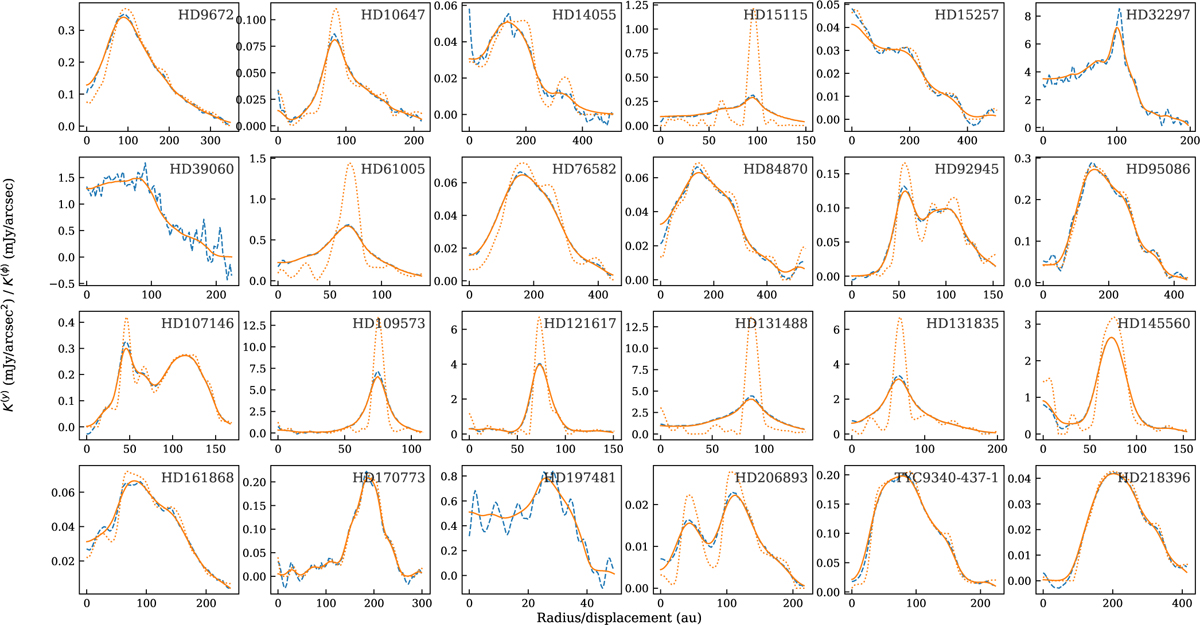
1D quantities that rave fits to. This includes the vertically summed flux (K(y)) of the CLEAN image (blue dashed line) and rave model (solid orange line) for the edge-on discs (HD 39060, HD 197481, and HD 32297), and the azimuthally averaged profiles (K(φ)) of the CLEAN image (blue dashed line) and (convolved) rave model image (solid orange line), with the (deconvolved) rave profile overplotted (dotted orange line), for all other discs.
Current usage metrics show cumulative count of Article Views (full-text article views including HTML views, PDF and ePub downloads, according to the available data) and Abstracts Views on Vision4Press platform.
Data correspond to usage on the plateform after 2015. The current usage metrics is available 48-96 hours after online publication and is updated daily on week days.
Initial download of the metrics may take a while.