Fig. 2
Download original image
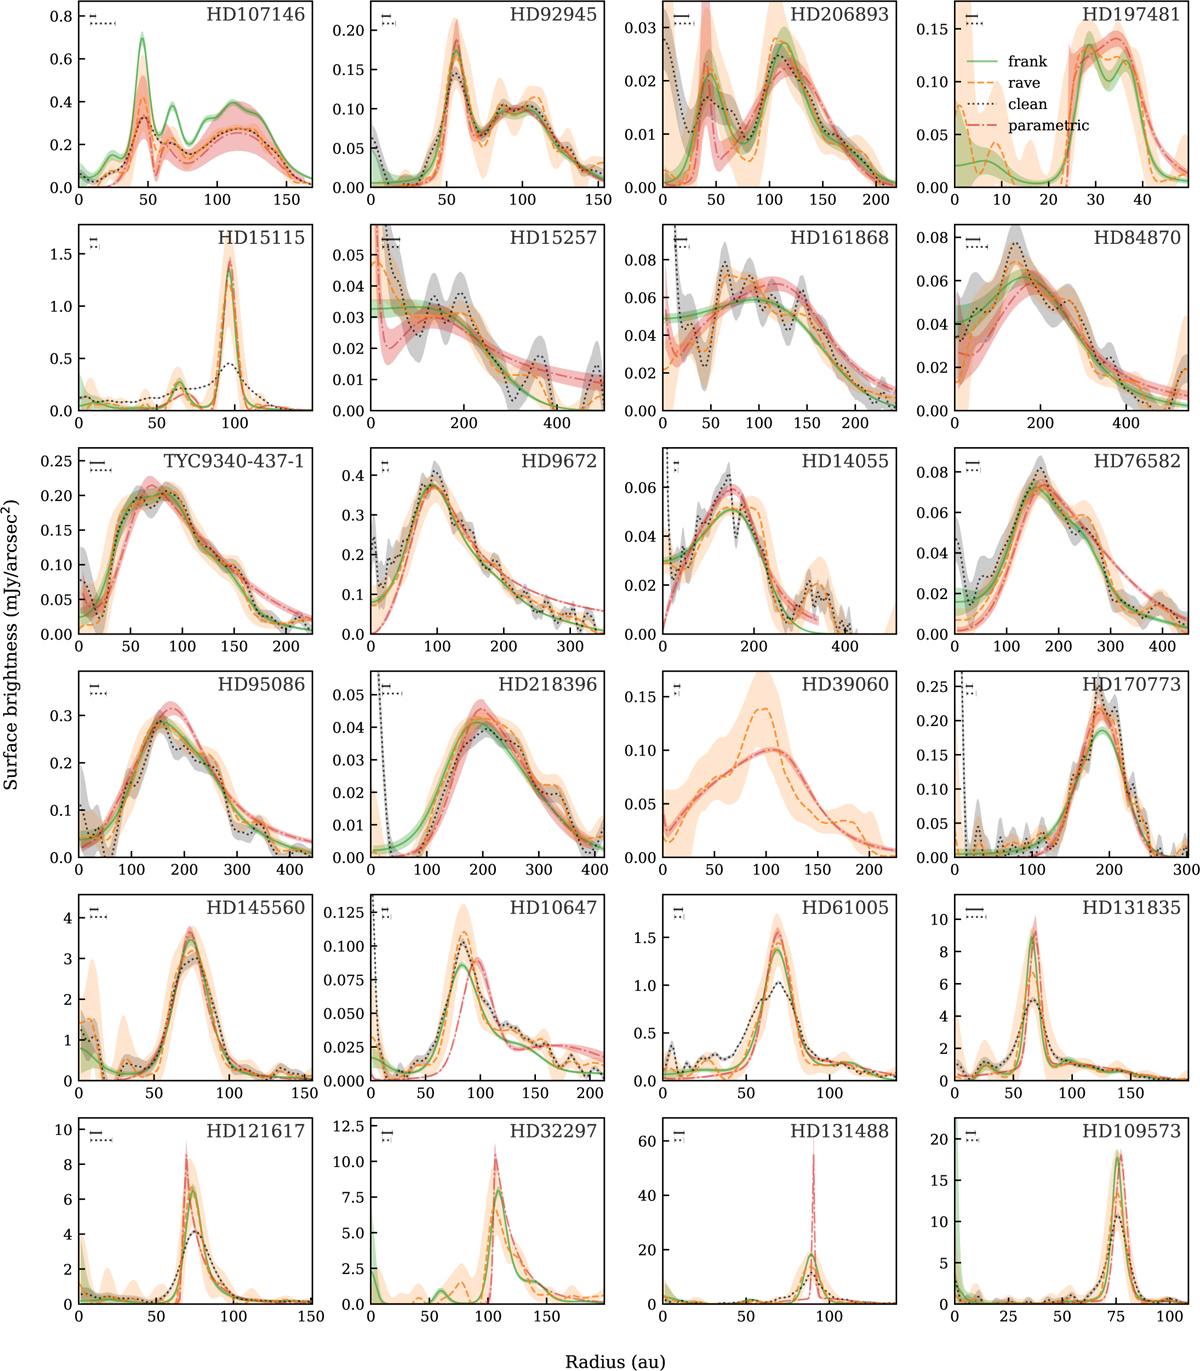
Azimuthally averaged radial profiles derived from the CLEAN image (dotted black) and the deconvolved and deprojected surface brightness profiles fitted with frank (solid green), rave (dashed orange), and parametric models (dash-dotted red). The robust parameters used for CLEAN imaging are listed in Table G.1. The solid bars in the upper left corner of each panel indicate the FWHM resolved by frank if the radial profile were infinitesimally narrow (i.e. the frank PSF). The dotted bars indicate the synthesised beam size. In general, oscillations in the CLEAN profile that are likely due to noise (e.g. as seen in HD 15257 and HD 161868) are smoothed out in the frank, rave, and parametric models. The deconvolved peaks recovered by the frank, rave, and parametric models are often sharper than seen in the (beam-convolved) CLEAN images; the most extreme case is the best-fitting parametric model for HD 131488. We note that not all methods are applicable to every disc (e.g. azimuthal averaging was not applied to edge-on discs to extract the CLEAN profile, and frank was not applied to HD 39060 due to mosaicking being used in the observations). The offset between rave and frank for HD 107146 is due to the two methods fitting at different effective wavelengths.
Current usage metrics show cumulative count of Article Views (full-text article views including HTML views, PDF and ePub downloads, according to the available data) and Abstracts Views on Vision4Press platform.
Data correspond to usage on the plateform after 2015. The current usage metrics is available 48-96 hours after online publication and is updated daily on week days.
Initial download of the metrics may take a while.