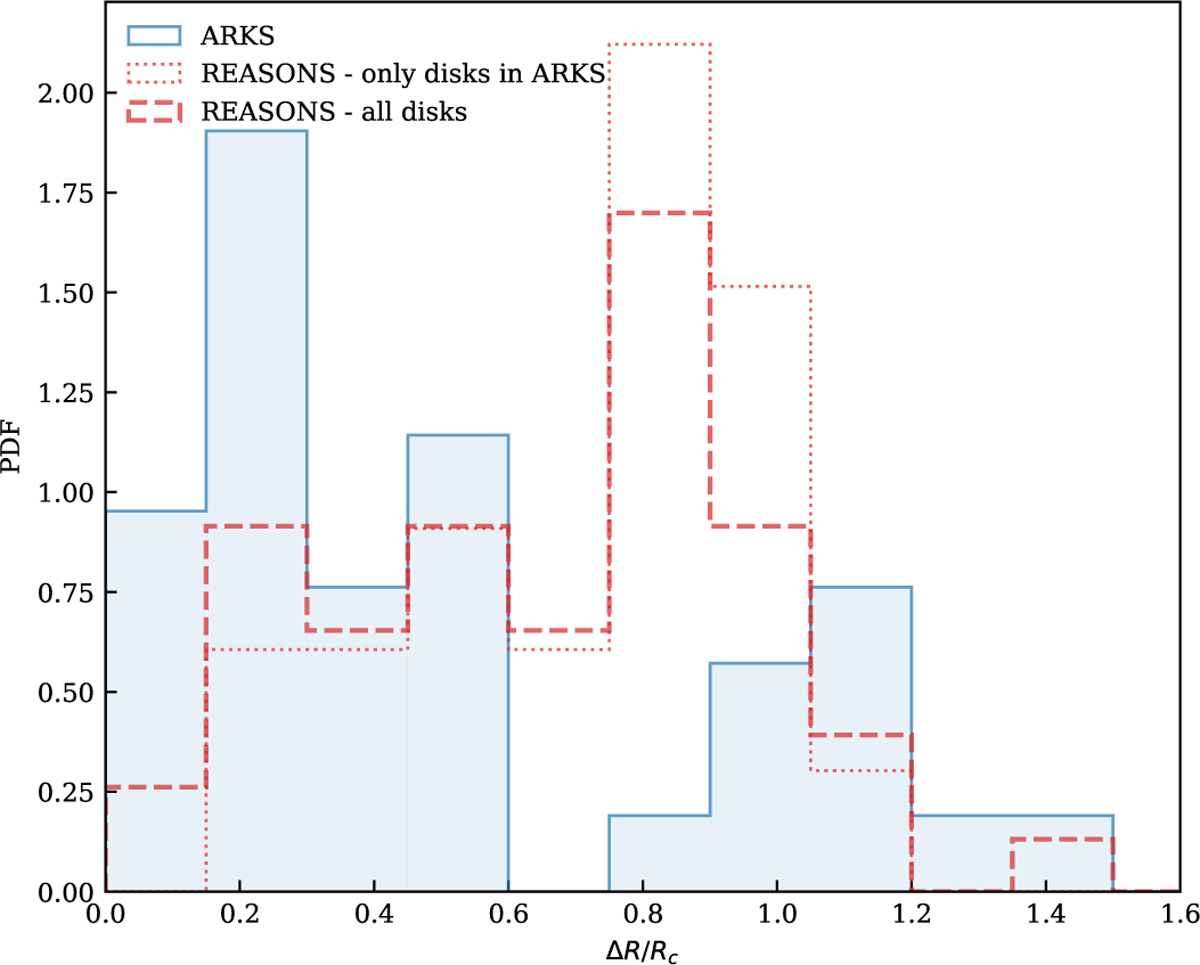
Fig. 5
Download original image
Comparison between the distribution of fractional widths found from the REASONS (Matrà et al. 2025) and ARKS datasets. The vertical axis shows the probability density function (PDF). Discs found to have multiple rings in ARKS are separated into their constituent rings. Two distributions are shown for REASONS, which correspond to the distribution of all REASONS discs, and the REASONS values for discs that overlap with those in ARKS respectively. REASONS discs with fractional uncertainties greater than 0.5 have been excluded from the REASONS distributions.
Current usage metrics show cumulative count of Article Views (full-text article views including HTML views, PDF and ePub downloads, according to the available data) and Abstracts Views on Vision4Press platform.
Data correspond to usage on the plateform after 2015. The current usage metrics is available 48-96 hours after online publication and is updated daily on week days.
Initial download of the metrics may take a while.