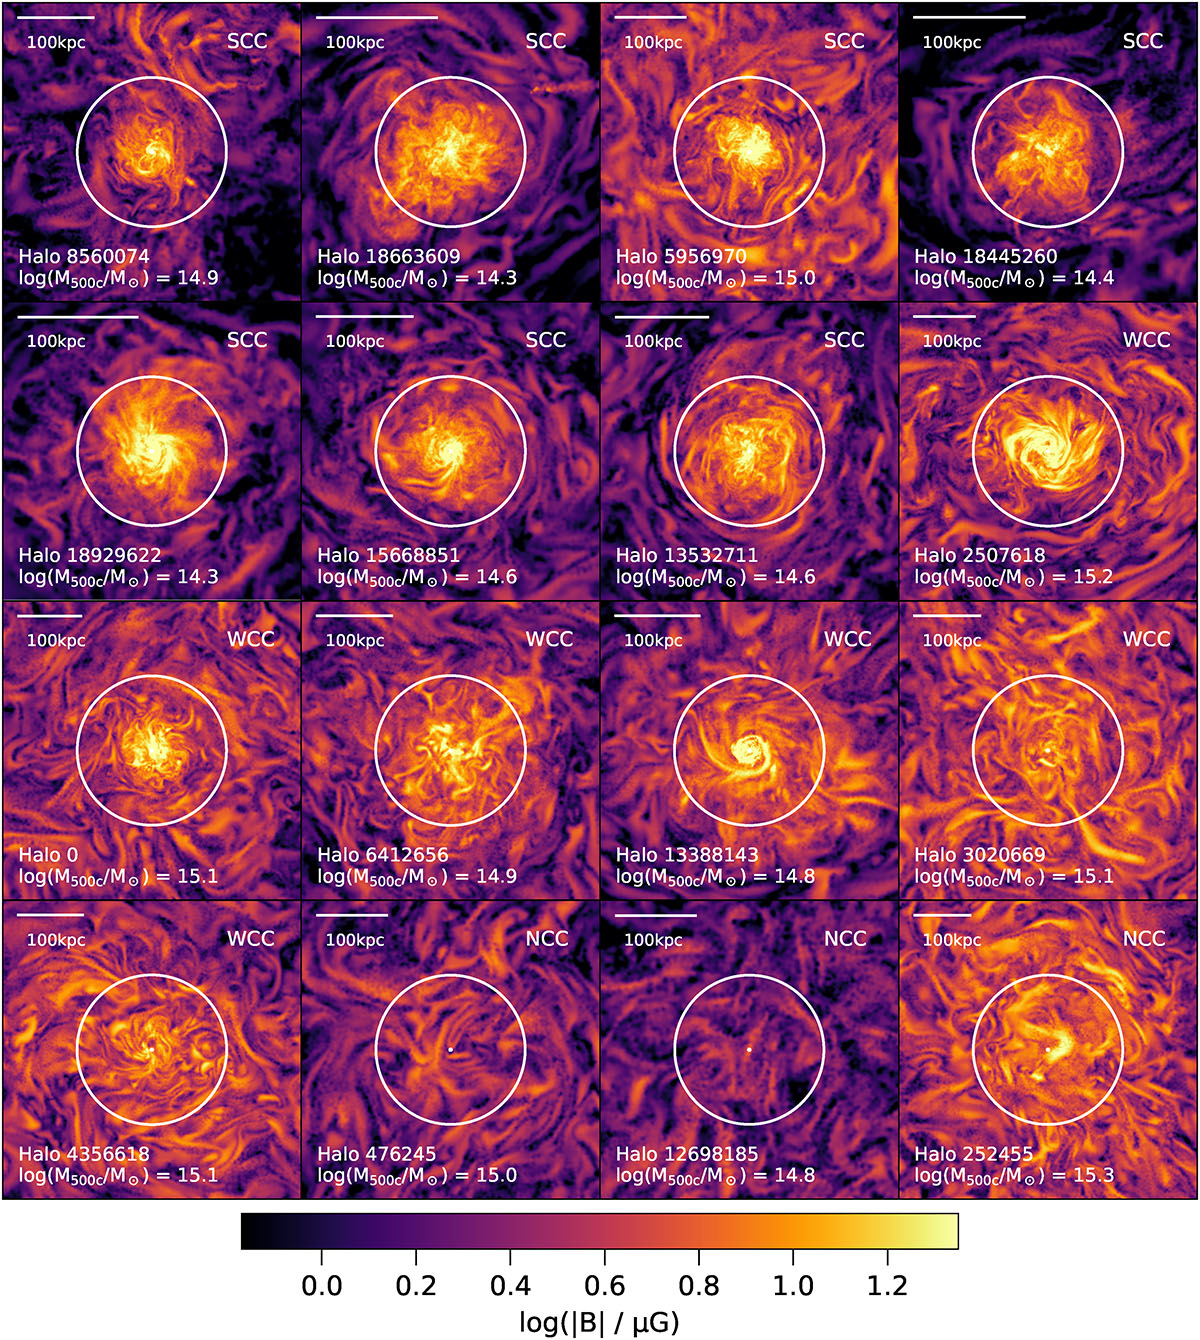
Fig. 1.
Download original image
Gallery of magnetic field strength and morphology in sixteen high-mass galaxy clusters selected from TNG-Cluster at z = 0. Each panel shows the central region and extends 0.2r500c from side-to-side, giving projections of mean magnetic field strength in a thin slice of 15 kpc depth. The white circles indicate 0.1r500c. The panels are ordered by ascending central entropy K0, such that the strongest CC systems are in the upper left, and the strongest NCC halos are located in the bottom right. Central magnetic field strength increases rapidly with halo mass, and is higher in CC versus NCC clusters.
Current usage metrics show cumulative count of Article Views (full-text article views including HTML views, PDF and ePub downloads, according to the available data) and Abstracts Views on Vision4Press platform.
Data correspond to usage on the plateform after 2015. The current usage metrics is available 48-96 hours after online publication and is updated daily on week days.
Initial download of the metrics may take a while.