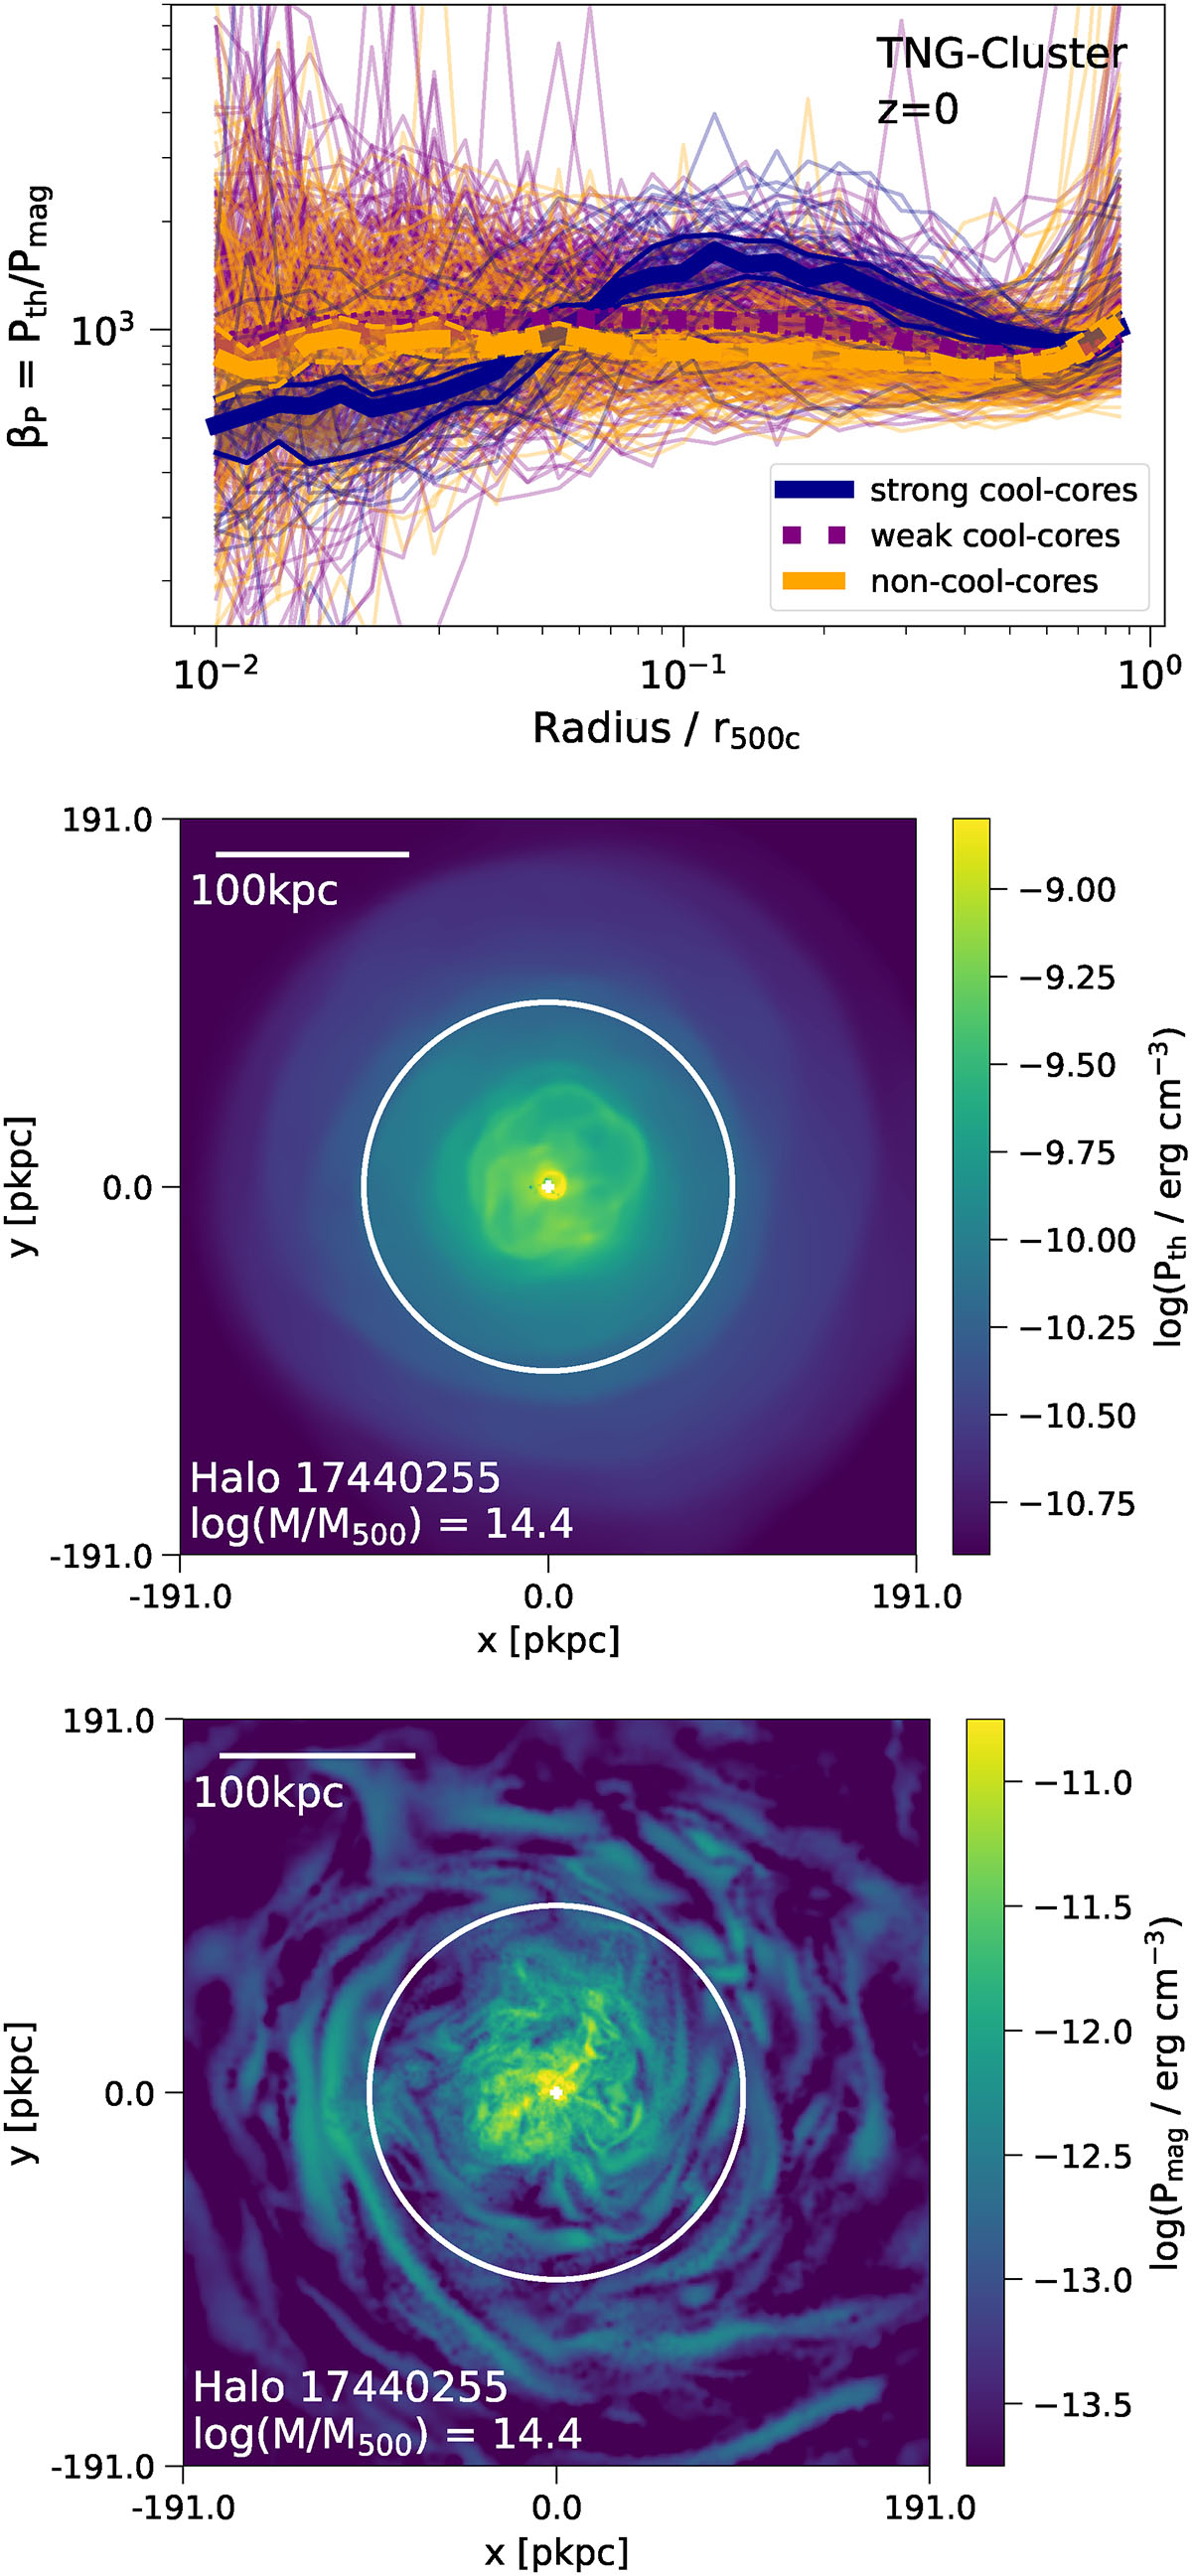
Fig. 4.
Download original image
Main panel: Radial profiles of the plasma beta parameter βP at z = 0 for all TNG-Cluster halos, colored according to CC state. Thin lines show individual clusters, while the three thick lines show median stacks of SCC, WCC, and NCC clusters. The shaded bands around the median show the 95% confidence intervals. Lower panels: Maps of the thermal pressure (left) and magnetic pressure (right) of one individual SCC halo ans an example. Both maps show the central region with r < 0.2r500c for a slice with depth 15 kpc. The overall pressure budget is dominated by the thermal pressure for both CCs and NCCs. The βP profiles for WCCs and NCCs are flat with average values of βP ∼ 900. SCCs have a small dip in the core and a excess at 0.1r500c. However, these trends are rather weak.
Current usage metrics show cumulative count of Article Views (full-text article views including HTML views, PDF and ePub downloads, according to the available data) and Abstracts Views on Vision4Press platform.
Data correspond to usage on the plateform after 2015. The current usage metrics is available 48-96 hours after online publication and is updated daily on week days.
Initial download of the metrics may take a while.