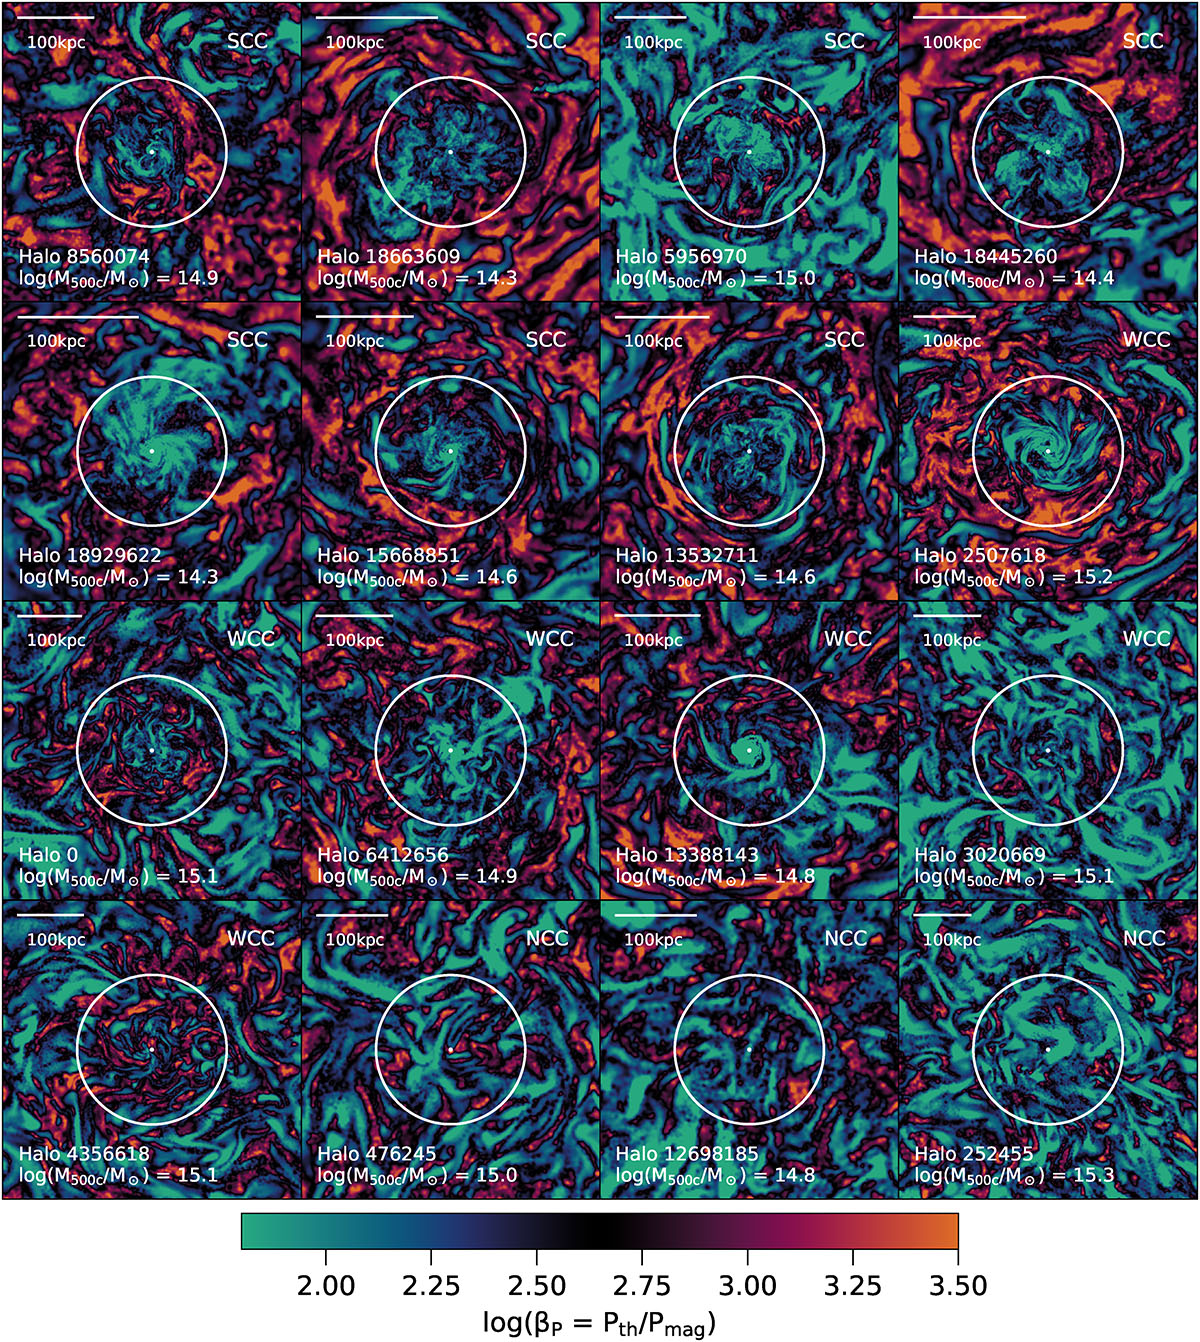
Fig. 5.
Download original image
Gallery of the plasma beta parameter βP at z = 0 for the same sixteen TNG-Cluster halos and the same setup as in Fig. 1. Each panel shows the central region and extends 0.2r500c from side-to-side, while the white circles indicate 0.1r500c. As the panels are ordered by ascending central entropy K0, we also see that in some of the SCCs the decrease of βP toward the core is amply visible. We also find lower beta for more massive clusters, in agreement with Marinacci et al. (2018).
Current usage metrics show cumulative count of Article Views (full-text article views including HTML views, PDF and ePub downloads, according to the available data) and Abstracts Views on Vision4Press platform.
Data correspond to usage on the plateform after 2015. The current usage metrics is available 48-96 hours after online publication and is updated daily on week days.
Initial download of the metrics may take a while.