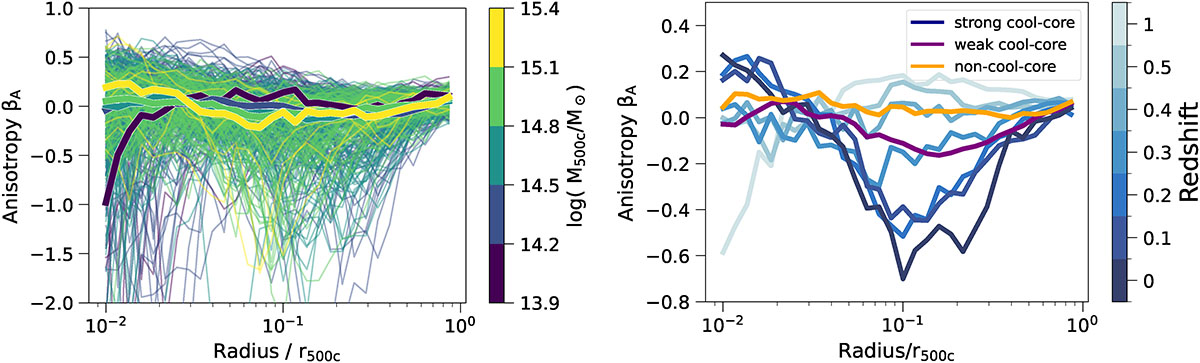
Fig. 7.
Download original image
Left: Mass trends of the anisotropy profiles for all halos in TNG-Cluster. The thin lines show individual halos, while the thick lines show medians in mass bins. There are only weak trends in the average magnetic anisotropy with cluster mass. Right: Median redshift trends of the anisotropy profiles for all SCCs in TNG-Cluster; the redshift evolution for WCCs and NCCs is not shown, as it is consistent with a flat radial profile for all redshifts. In SCCs, the population wide dip in βA decreases toward higher redshifts, until z = 0.4, where the profiles become flat and consistent with the WCC and NCC profiles.
Current usage metrics show cumulative count of Article Views (full-text article views including HTML views, PDF and ePub downloads, according to the available data) and Abstracts Views on Vision4Press platform.
Data correspond to usage on the plateform after 2015. The current usage metrics is available 48-96 hours after online publication and is updated daily on week days.
Initial download of the metrics may take a while.