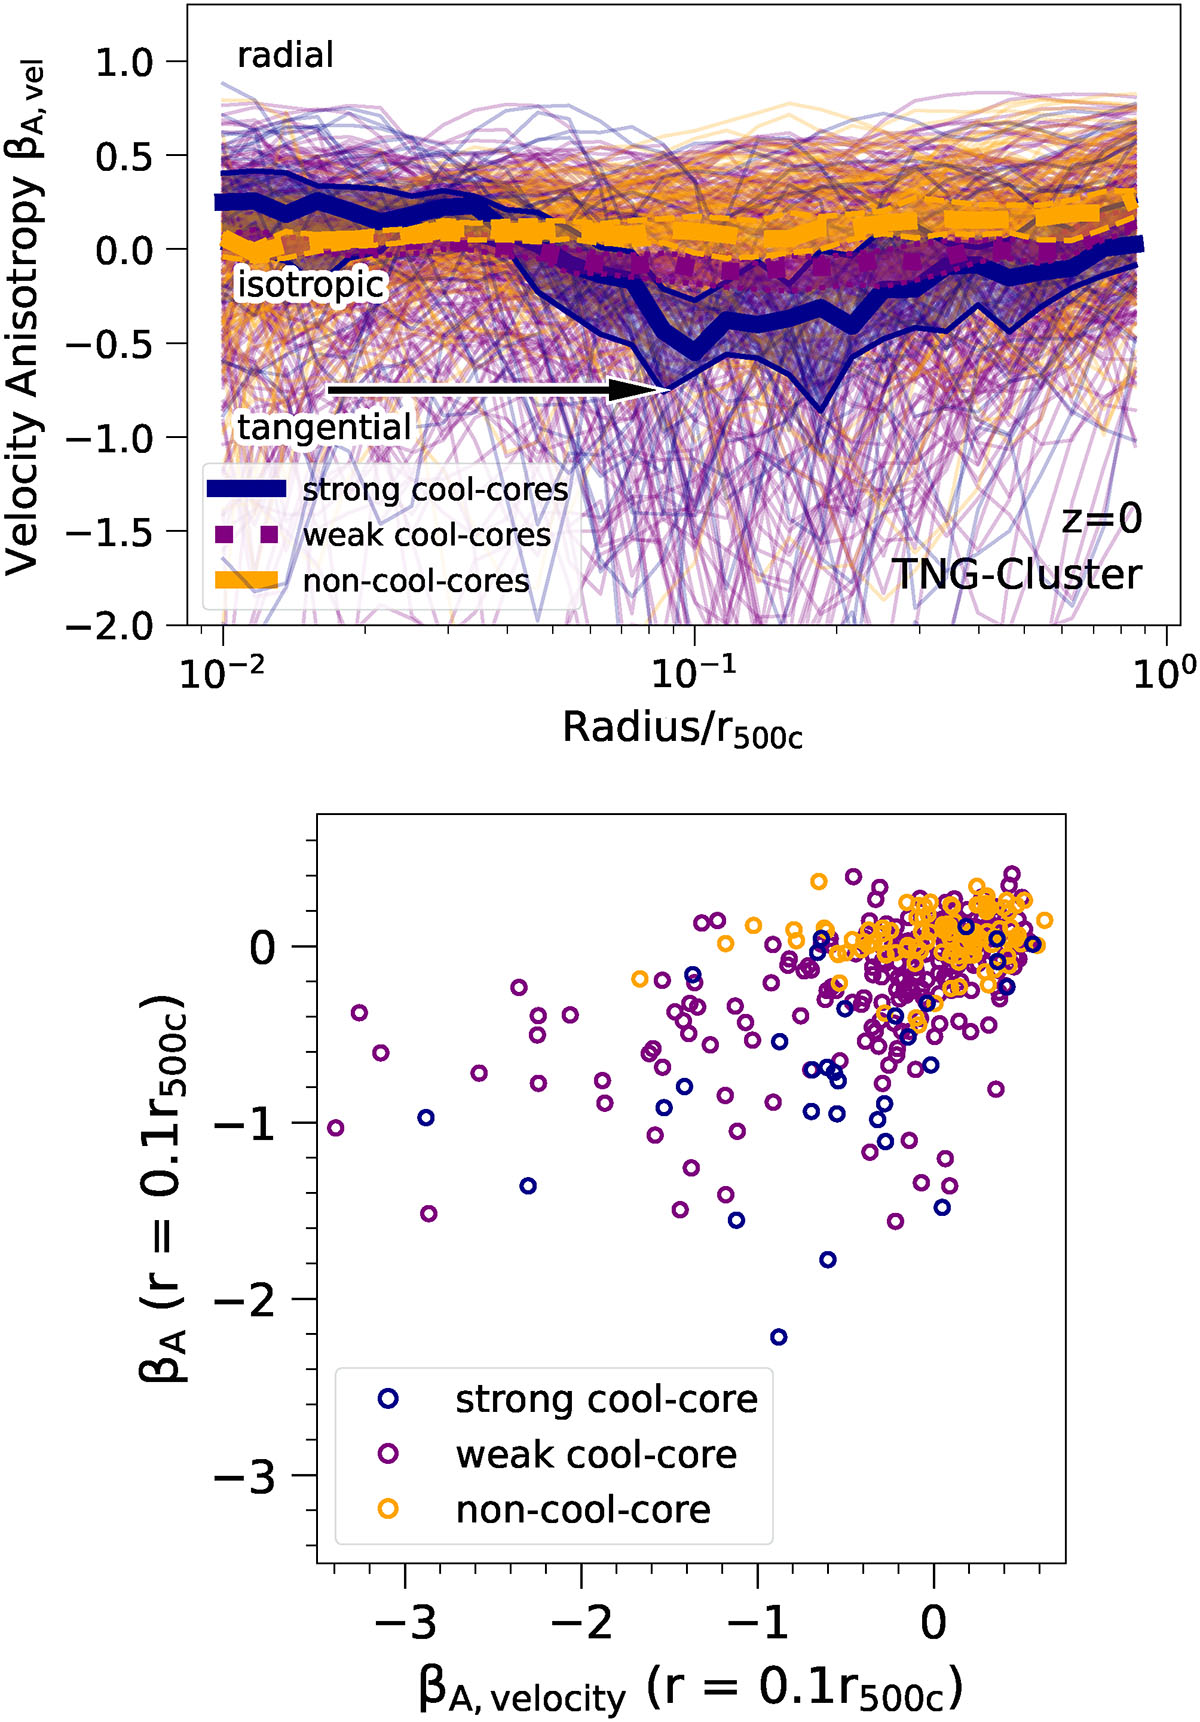
Fig. 9.
Download original image
Top: Radial profiles of velocity anisotropy, where thin lines show individual halos from TNG-Cluster at z = 0, and thick lines show median stacks. The shaded bands represent the 95% confidence intervals. The horizontal arrow is plotted at exactly the same location as the arrow in Fig. 6. The median profiles for WCCs and NCCs are compatible with an isotropic velocity fields. There is a somewhat population wide tangential bias in SCCs, albeit smaller compared to the magnetic anisotropy. Importantly, we find among all cluster types many individual examples of halos with dips at all radii. Bottom: Correlation between magnetic and velocity anisotropy parameters, both measured at the same r = 0.1r500c.
Current usage metrics show cumulative count of Article Views (full-text article views including HTML views, PDF and ePub downloads, according to the available data) and Abstracts Views on Vision4Press platform.
Data correspond to usage on the plateform after 2015. The current usage metrics is available 48-96 hours after online publication and is updated daily on week days.
Initial download of the metrics may take a while.