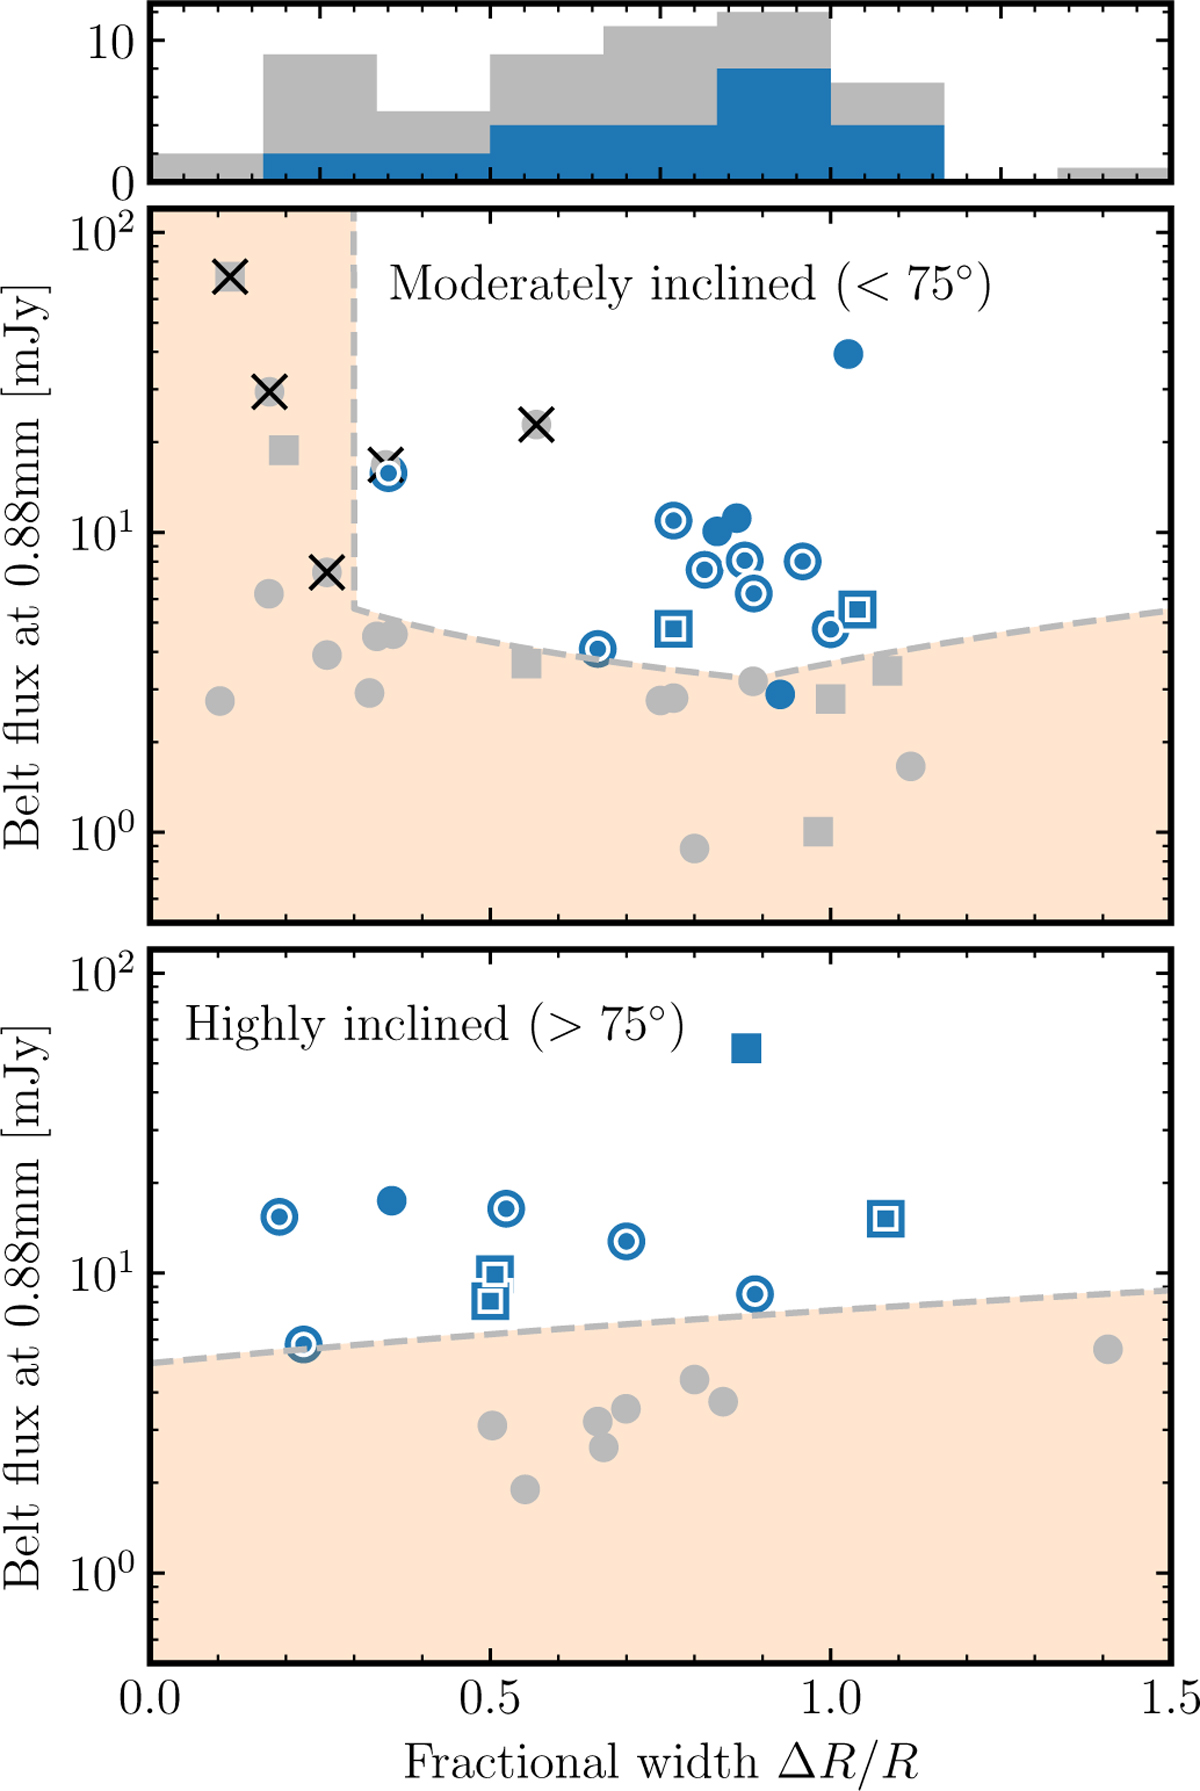
Fig. 1
Download original image
Distribution of fractional widths vs belt fluxes at 0.88 mm. Top: histogram of all REASONS belts with resolved widths (grey) and those analysed in ARKS (blue, including six with archival observations). Middle: distribution of fractional widths vs expected belt fluxes for moderately inclined belts. Bottom: distribution of fractional widths vs expected belt fluxes for highly inclined belts. The blue markers represent ARKS targets (double markers: newly observed; single markers: archival data). The square symbols represent systems with CO gas, and the black crosses represent systems too large to be observed without mosaicking. The dashed line represents the 10 μJy sensitivity limit chosen for ARKS (Eqs. (1) and (3)), below which belts were excluded unless already observed (orange shaded region). The grey markers represent belts in REASONS that were excluded for being too large, too wide, or too faint for high-resolution observations.
Current usage metrics show cumulative count of Article Views (full-text article views including HTML views, PDF and ePub downloads, according to the available data) and Abstracts Views on Vision4Press platform.
Data correspond to usage on the plateform after 2015. The current usage metrics is available 48-96 hours after online publication and is updated daily on week days.
Initial download of the metrics may take a while.