Fig. 3
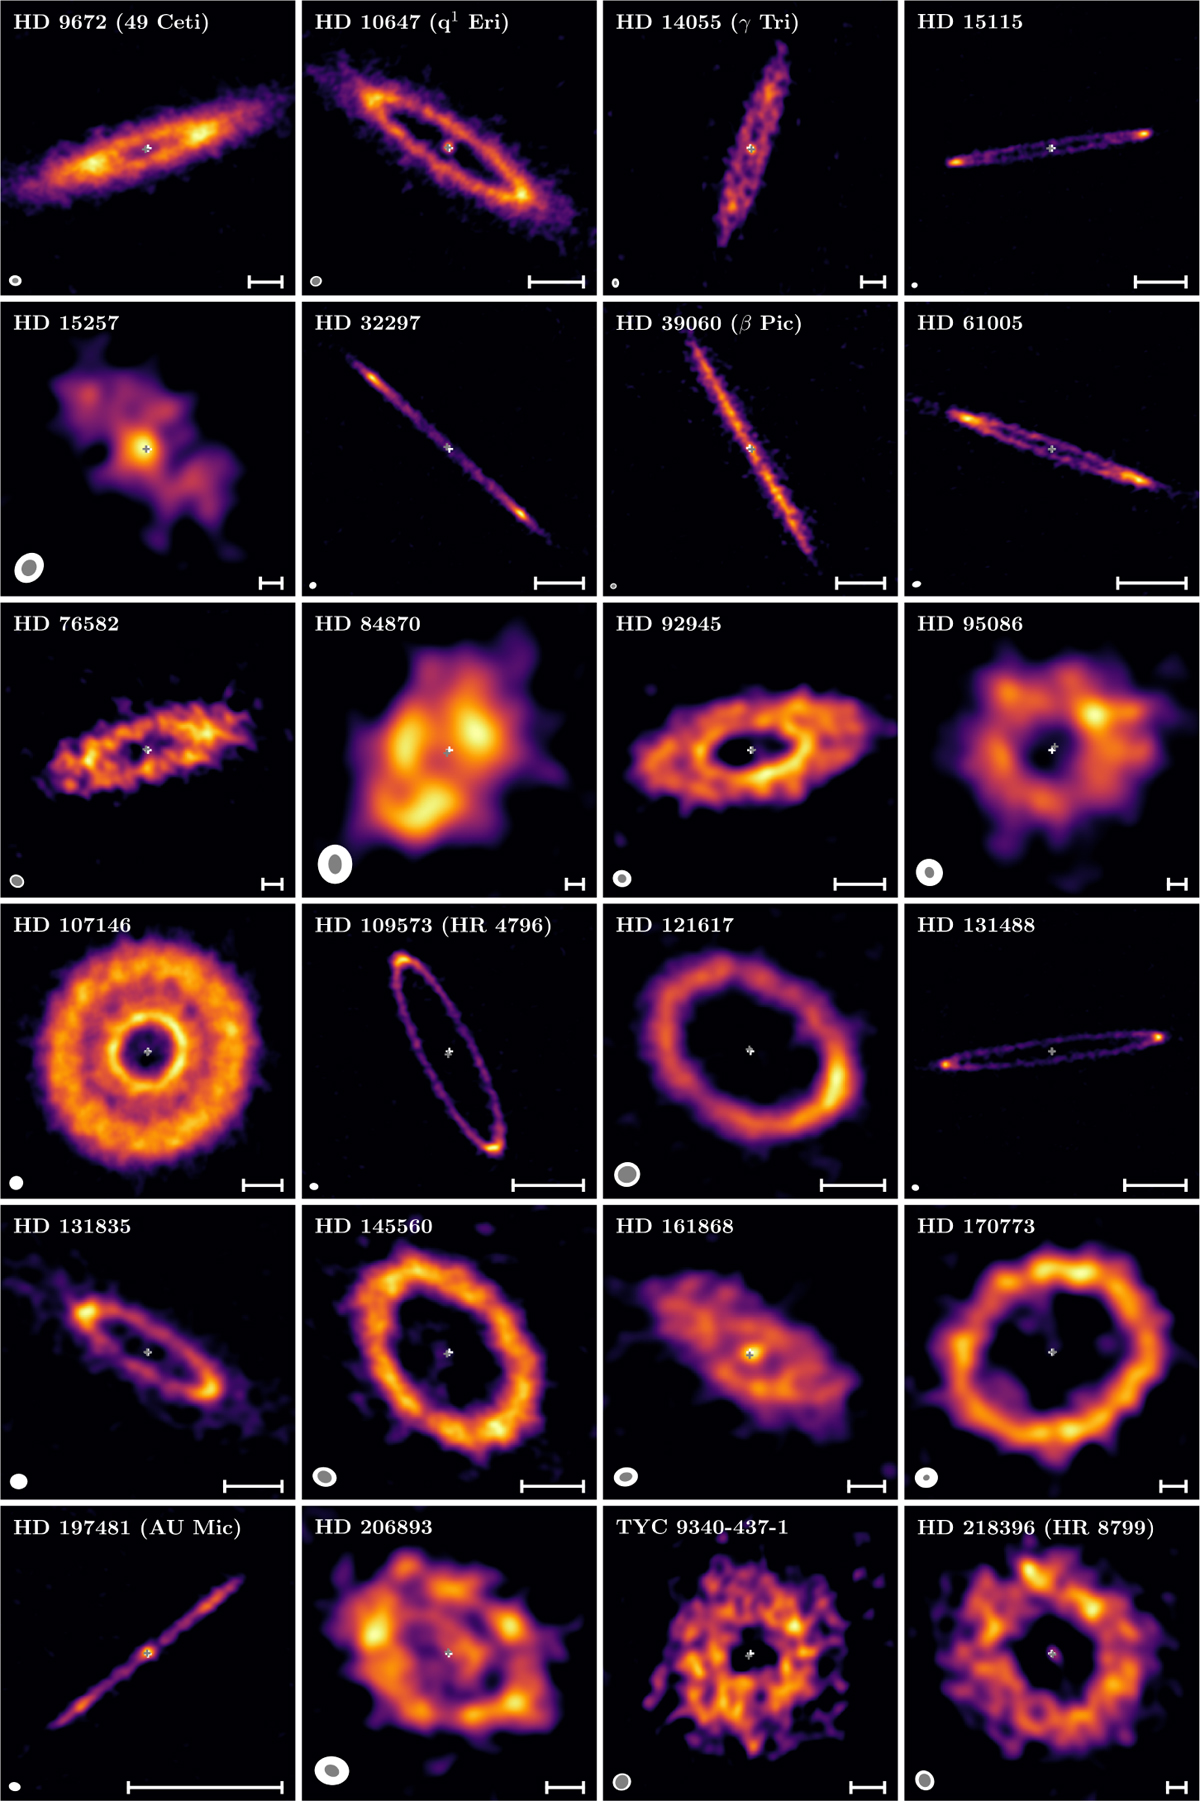
Download original image
ARKS continuum clean images of the 24 systems in the sample after correction and subtraction of any SMG. The beam size is shown as a white ellipse in the bottom left corner. For sources imaged with a robust parameter greater than 0.5, an additional grey ellipse represents the beam size using a robust value of 0.5. The white ticks at the edges are spaced by 1", while the scale bar at the bottom right corner represents a projected distance of 50 au. The white cross represents the expected stellar position according to Gaia DR3, while the grey cross represents the best-fit centre of the system assuming a circular belt. For better clarity, each panel uses its own colour scale from 3×rms to the image peak.
Current usage metrics show cumulative count of Article Views (full-text article views including HTML views, PDF and ePub downloads, according to the available data) and Abstracts Views on Vision4Press platform.
Data correspond to usage on the plateform after 2015. The current usage metrics is available 48-96 hours after online publication and is updated daily on week days.
Initial download of the metrics may take a while.