Fig. F.1
Download original image
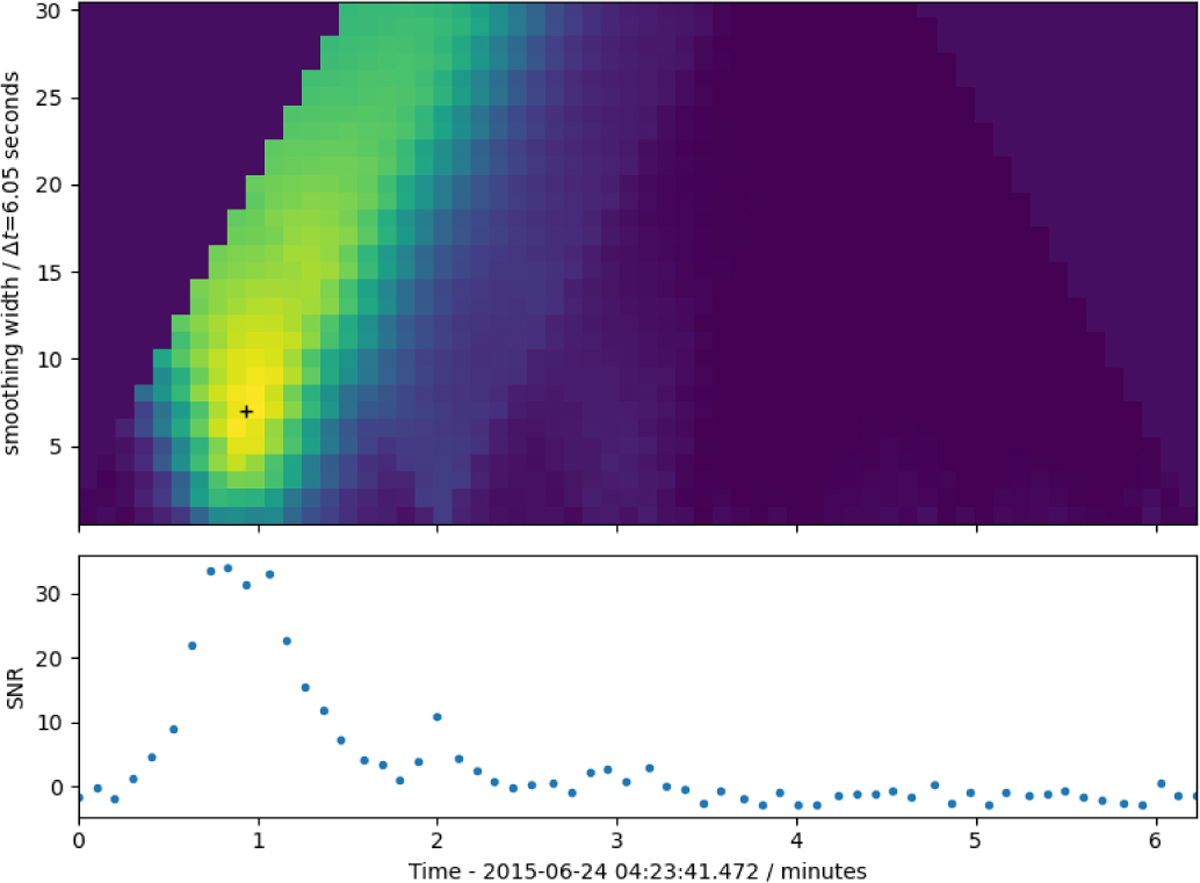
Example of the stellar variability search output for scan 27 from the 2015 AU Mic data. The lower panel shows the S/N vs. time for a single scan (27), with one large flare visible. The colour scale in the upper panel shows the mean-filtered data from the lower panel using a window of the width given on the y-axis to increase the S/N for flares with a duration greater than 6 seconds. The flare is mostly strongly detected for a window of 7 × 6 s, as indicated by the plus sign (+) in the upper panel.
Current usage metrics show cumulative count of Article Views (full-text article views including HTML views, PDF and ePub downloads, according to the available data) and Abstracts Views on Vision4Press platform.
Data correspond to usage on the plateform after 2015. The current usage metrics is available 48-96 hours after online publication and is updated daily on week days.
Initial download of the metrics may take a while.