Fig. 1
Download original image
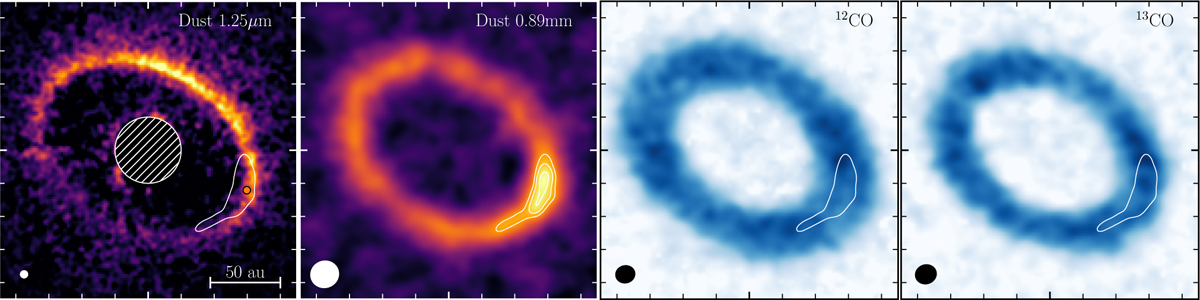
Dust and gas images of HD 121617. Left panel: scattered light VLT/SPHERE Qϕ image at 1.25 μm (J band) observed in polarised light with IRDIS (Milli et al. 2026), smoothed with a Gaussian with a standard deviation of 1 pixel (12 mas). The central hatched region masks an area dominated by strong artefacts. The small orange circle in the SW ansa marks the pericentre location as constrained by Milli et al. (2026). Middle left panel: ALMA dust continuum image at 0.89 mm (Marino et al. 2026). Middle right panel: 12CO J=3-2 moment 0 image (Mac Manamon et al. 2026). Right panel: 13CO J=3-2 moment 0 image (Mac Manamon et al. 2026). The white contours in the middle left image represent 75, 85, and 95% of the peak intensity. The 75% contour is also shown in the other images for reference. The ALMA continuum and CO images were obtained with CLEAN using robust parameters of 1.0 and 0.5, respectively. The beam and PSF sizes are shown as ellipses in the bottom left of each panel. The minor ticks in all panels are spaced by ![]() .
.
Current usage metrics show cumulative count of Article Views (full-text article views including HTML views, PDF and ePub downloads, according to the available data) and Abstracts Views on Vision4Press platform.
Data correspond to usage on the plateform after 2015. The current usage metrics is available 48-96 hours after online publication and is updated daily on week days.
Initial download of the metrics may take a while.